
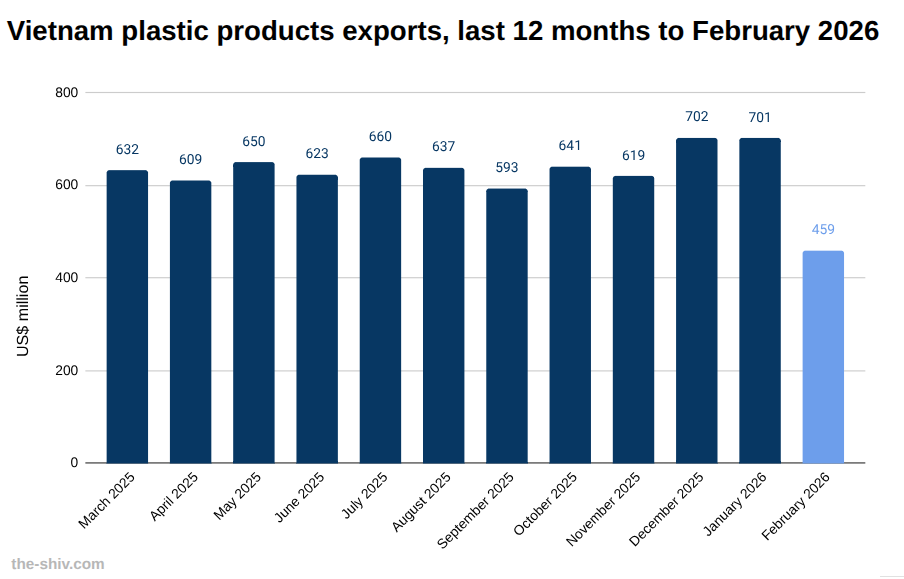
Vietnam exported plastic products to the tune of US$459 million in February, down from US$701 million in January, a change of -34.50 percent, according to preliminary data from Vietnam’s General Department of Customs.
Year to date, Vietnam exported US$1,162 million worth of plastic products by the end of February.
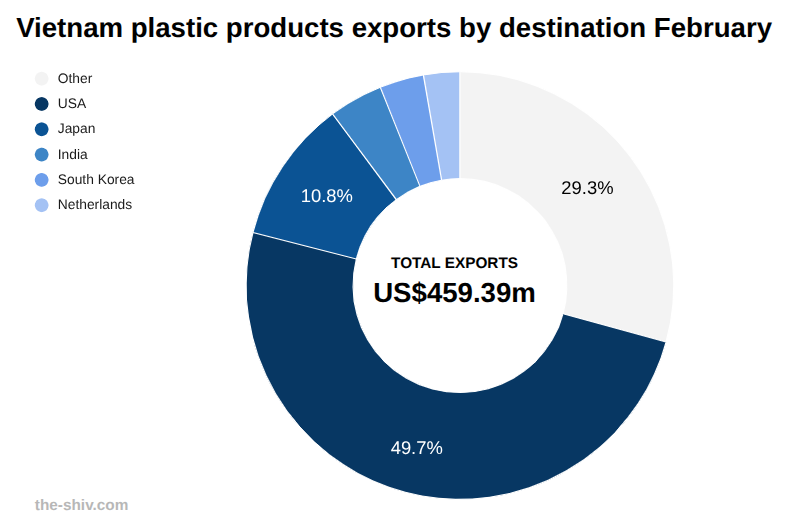
The United States led in February with US$228 million, down from US$358 million in January, bringing year-to-date exports to US$587 million.
Japan followed with US$50 million, ahead of India at US$19 million and South Korea at US$15 million, all recording month-on-month declines.
The Netherlands rounded out the top five with US$13 million in February, with all major markets posting lower export values compared to January.
Learn more about manufacturing in Vietnam→
Listed plastics companies
Key plastics firms listed on the Vietnam stock exchange include:
An Phat Bioplastics JSC (AAA)
An Phat Bioplastics JSC (AAA) manufactures and exports biodegradable packaging, plastic resins, and environmentally friendly materials. (AAA)
In February, AAA shares moved from 7.95 to 7.90, a change of -0.05 (-0.01 percent).
Foreign ownership moved from 3,869,946.28 to 3,868,751.23, a change of -1,195.05 (0.00 percent).
Binh Minh Plastics JSC (BMP)
Binh Minh Plastics JSC (BMP) manufactures and distributes plastic pipes, fittings, and construction materials for water and drainage systems. (BMP)
In February, BMP shares moved from 163.00 to 158.50, a change of -4.50 (-0.03 percent).
Foreign ownership moved from 127,950.76 to 131,891.07, a change of 3,940.31 (0.03 percent).
HaNoi Plastics Joint Stock Company (NHH)
HaNoi Plastics Joint Stock Company (NHH)
In February, NHH shares moved from 11.10 to 11.00, a change of -0.10 (-0.01 percent).
Foreign ownership moved from 1,125,754.40 to 1,125,961.40, a change of 207.00 (0.00 percent).
Rang Dong Plastics JSC (RYG)
Rang Dong Plastics JSC (RYG) produces packaging, plastic products, and household goods for domestic and export markets. (RYG)
In February, RYG shares moved from 10.75 to 10.80, a change of 0.05 (0.00 percent).
Foreign ownership moved from 224,690.00 to 224,597.00, a change of -93.00 (0.00 percent).
Explore opening a trading account in Vietnam→
Vietnam plastics news
Recent developments in plastic products in Vietnam include:
Plastics imports February
Vietnam imported plastics to the tune of US$758 million in February, down from US$1,110 million in January, a change of -31.72 percent, according to preliminary data from Vietnam’s General Department of Customs. Read more→
Resin shortages
Rising polyethylene and polypropylene resin prices, up around 40–50 percent since late 2025, are squeezing Vietnam’s packaging firms and disrupting supply chains.
Businesses report packaging cost increases of 40–50 percent, with plastic bag prices rising from VND40,000 to VND55,000 (US$2.1) per kilogram, compressing margins. Read more→
See the latest Vietnam news headlines→
Vietnam’s plastics industry
Vietnam’s plastics industry is a key manufacturing sector, supporting packaging, construction, electronics, and consumer goods production.
The industry has grown alongside export-oriented manufacturing, driven by demand from food processing, retail, and industrial supply chains.
However, it remains heavily reliant on imported raw materials, exposing producers to global price volatility and supply risks.
Going forward, the sector is increasingly focused on recycling, sustainable materials, and regulatory compliance as environmental pressures and export standards tighten.
Find out about starting a business in Vietnam→
The data
Vietnam exports of plastic products in February, 2026 US$m
| February | January | MoM | YTD | |
| Total | 459.39 | 701.35 | -34.50% | 1,162.05 |
| Other | 13.15 | 18.90 | -30.43% | 33.37 |
| USA | 228.48 | 358.06 | -36.19% | 586.54 |
| Japan | 49.84 | 68.73 | -27.48% | 118.57 |
| India | 18.74 | 28.47 | -34.19% | 47.21 |
| South Korea | 15.36 | 23.21 | -33.83% | 38.56 |
| Netherlands | 12.59 | 21.22 | -40.68% | 33.80 |
| Germany | 11.05 | 16.48 | -32.96% | 27.53 |
| China | 10.58 | 17.89 | -40.85% | 28.46 |
| Cambodia | 10.40 | 16.80 | -38.12% | 27.20 |
| Indonesia | 9.80 | 14.87 | -34.09% | 24.67 |
| UK | 7.27 | 12.61 | -42.36% | 19.87 |
| Thailand | 6.67 | 10.30 | -35.27% | 16.97 |
| Australia | 5.90 | 8.98 | -34.29% | 14.89 |
| Poland | 5.62 | 6.18 | -9.17% | 11.80 |
| Canada | 5.35 | 8.52 | -37.23% | 13.87 |
| Hong Kong | 5.29 | 7.81 | -32.24% | 13.10 |
| Belgium | 4.59 | 7.30 | -37.11% | 11.89 |
| Philippines | 4.52 | 5.81 | -22.23% | 10.32 |
| Malaysia | 4.06 | 5.77 | -29.66% | 9.83 |
| Mexico | 3.93 | 6.62 | -40.70% | 10.55 |
| Taiwan | 3.76 | 5.48 | -31.39% | 9.24 |
| France | 3.12 | 5.05 | -38.07% | 8.17 |
| Spain | 2.47 | 3.66 | -32.44% | 6.13 |
| Myanmar | 2.36 | 2.64 | -10.90% | 5.00 |
| Italy | 2.26 | 2.48 | -8.68% | 4.74 |
| Russia | 1.68 | 1.93 | -12.64% | 3.61 |
| Denmark | 1.61 | 2.46 | -34.75% | 4.07 |
| Laos | 1.37 | 1.91 | -28.30% | 3.27 |
| Sweden | 1.14 | 1.68 | -31.84% | 2.82 |
| Singapore | 1.13 | 1.70 | -33.39% | 2.83 |
| New Zealand | 0.84 | 1.31 | -36.00% | 2.15 |
| UAE | 0.82 | 1.21 | -32.40% | 2.02 |
| Czech Republic | 0.79 | 1.26 | -37.12% | 2.05 |
| Greece | 0.66 | 0.55 | 19.16% | 1.22 |
| Turkey | 0.53 | 0.56 | -5.14% | 1.09 |
| Bangladesh | 0.40 | 1.01 | -60.36% | 1.42 |
| Finland | 0.39 | 0.70 | -45.17% | 1.09 |
| Austria | 0.32 | 0.00 | 0.00% | 0.63 |
| Cyprus | 0.27 | 0.36 | -25.06% | 0.63 |
| Ukraine | 0.15 | 0.18 | -18.05% | 0.33 |
| Switzerland | 0.12 | 0.23 | -50.44% | 0.35 |
| Norway | 0.03 | 0.14 | -76.20% | 0.18 |
| Saudi Arabia | 0.00 | 0.31 | -100.00% | 0.00 |