
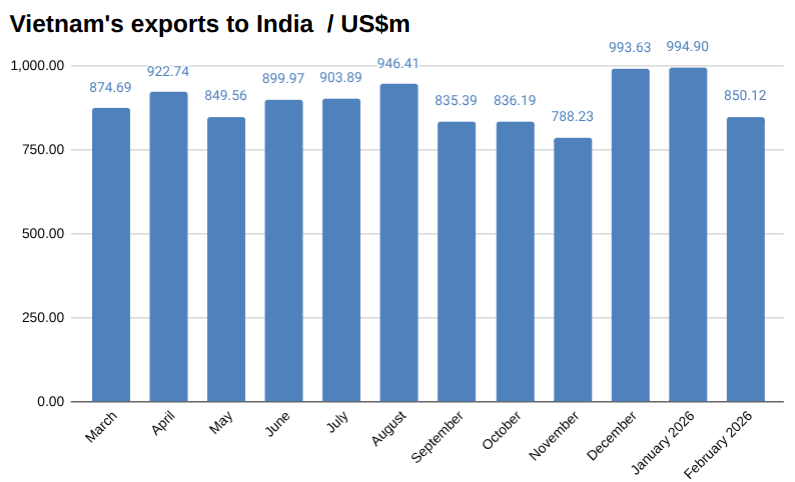
In February, Vietnam exported US$850 million worth of goods to India, down 14.55 percent over January, according to preliminary data from Vietnam’s General Department of Customs.
Learn more about manufacturing in Vietnam→
Vietnam trade with India YTD
In February, Vietnam imported US$475.74 million worth of goods from India and exported US$850.12 million to India, for total trade worth US$1,325.87 million, and leaving a trade surplus of US$374.38 million.
Two-way trade so far this year between Vietnam and India has reached US$3,005 million, with Vietnam importing US$1,160 million worth of goods and exporting US$1,846 million worth of goods.
Discover more about trade in Vietnam→
Vietnam-India news
Recent developments involving the two countries include:
Imports from India in February
In February, Vietnam imported US$475.74 million worth of goods from India, down from US$678.58 million in January, a change of -29.89 percent, according to preliminary data from Vietnam’s General Department of Customs. Read more→
See the latest Vietnam news headlines→
Vietnam-India trade relations
Vietnam and India have steadily expanded economic ties since establishing diplomatic relations in 1972, with trade gaining momentum after Vietnam’s economic reforms and deeper regional integration.
Bilateral engagement strengthened further with the ASEAN-India Free Trade Agreement, which reduced tariffs and facilitated greater flows of goods between the two economies.
Both countries have also upgraded their relationship to a Comprehensive Strategic Partnership, reflecting broader cooperation across trade, investment, and supply chains.
Trade agreements and policy coordination continue to support growth in key sectors such as electronics, agriculture, and energy, while reinforcing long-term economic cooperation.
Explore starting a business in Vietnam→
The data
Vietnam trade with India year to date February 2026 US$m
| February | January | Change | YTD | |
| Imports | 475.74 | 678.58 | -29.89% | 1,159.74 |
| Exports | 850.12 | 994.90 | -14.55% | 1,845.56 |
| Total | 1,325.87 | 1,673.48 | -20.77% | 3,005.31 |
| Balance | 374.38 | 316.31 | 18.36% | 685.82 |
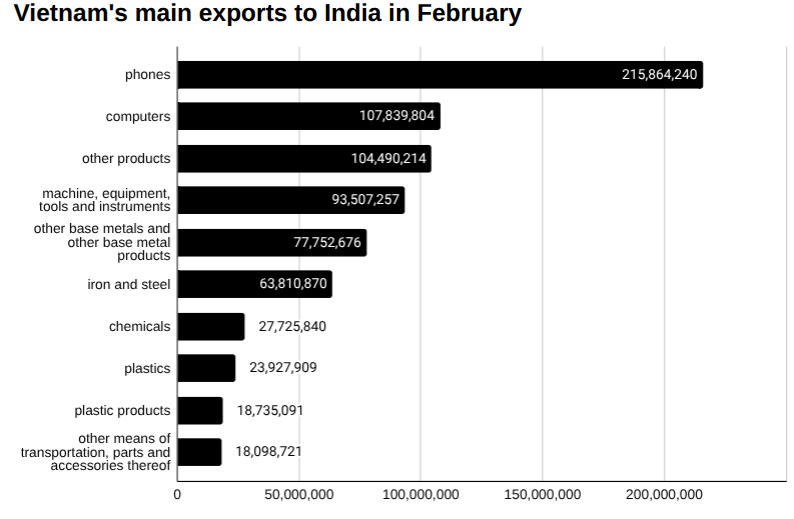
Vietnam exports to India in February 2026 US$m
| February | January | Change | YTD | |
| Total | 850.12 | 994.90 | -14.55% | 1,845.56 |
| Phones | 215.86 | 149.39 | 44.50% | 365.25 |
| Computers | 107.84 | 196.16 | -45.02% | 304.00 |
| Other products | 104.49 | 148.22 | -29.50% | 252.78 |
| Machine, equipment, tools and instruments | 93.51 | 93.25 | 0.28% | 186.76 |
| Other base metals and other base metal products | 77.75 | 103.68 | -25.01% | 181.43 |
| Iron and steel | 63.81 | 69.33 | -7.97% | 133.15 |
| Chemicals | 27.73 | 17.44 | 59.01% | 45.59 |
| Plastics | 23.93 | 28.07 | -14.76% | 52.00 |
| Plastic products | 18.74 | 28.47 | -34.19% | 47.21 |
| Other means of transportation, parts and accessories thereof | 18.10 | 25.11 | -27.92% | 43.21 |
| Textiles and garments | 16.10 | 22.77 | -29.29% | 38.87 |
| Rubber | 11.66 | 12.88 | -9.45% | 24.53 |
| Footwear | 11.38 | 15.76 | -27.78% | 27.14 |
| Textile and footwear materials | 10.66 | 16.20 | -34.19% | 26.85 |
| Chemical products | 10.06 | 10.07 | -0.10% | 20.14 |
| Coffee | 8.62 | 14.24 | -39.46% | 22.86 |
| Iron and steel products | 8.45 | 8.11 | 4.23% | 16.56 |
| Yarn | 4.36 | 6.70 | -34.95% | 11.06 |
| Animal fodders and animal fodder materials | 3.63 | 4.93 | -26.49% | 8.56 |
| Wood and wood products | 3.40 | 7.71 | -55.86% | 11.15 |
| Pepper | 3.25 | 6.04 | -46.23% | 9.28 |
| Bamboo and rattan products | 2.90 | 3.85 | -24.50% | 6.75 |
| Rubber products | 1.45 | 1.95 | -25.91% | 3.40 |
| Fishery products | 1.04 | 2.34 | -55.54% | 3.37 |
| Ceramic products | 0.49 | 0.61 | -19.87% | 1.09 |
| Cashew nut | 0.43 | 0.29 | 51.19% | 0.72 |
| Tea | 0.30 | 0.93 | -67.53% | 1.23 |
| Pastry, sweets and cereals products | 0.19 | 0.42 | -53.73% | 0.61 |
| Coal | 0.00 | 0.00 | 0.00% | 0.00 |