
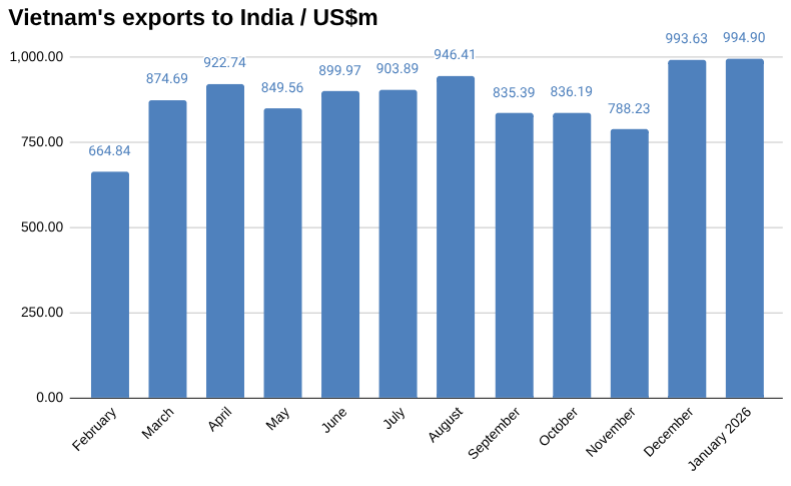
In January, Vietnam exported US$995 million worth of goods to India, up 0.13 percent over December, according to preliminary data from Vietnam’s General Department of Customs.
So far this year, Vietnam has exported US$995 million worth of goods to India.
Vietnam exported US$196.16 million worth of computers to India in January. This was down from US$210.99 million in December, a change of -7.03 percent.
It also exported US$149.39 million worth of phones to India in January. This was up from US$144.90 million in December, a change of 3.10 percent.
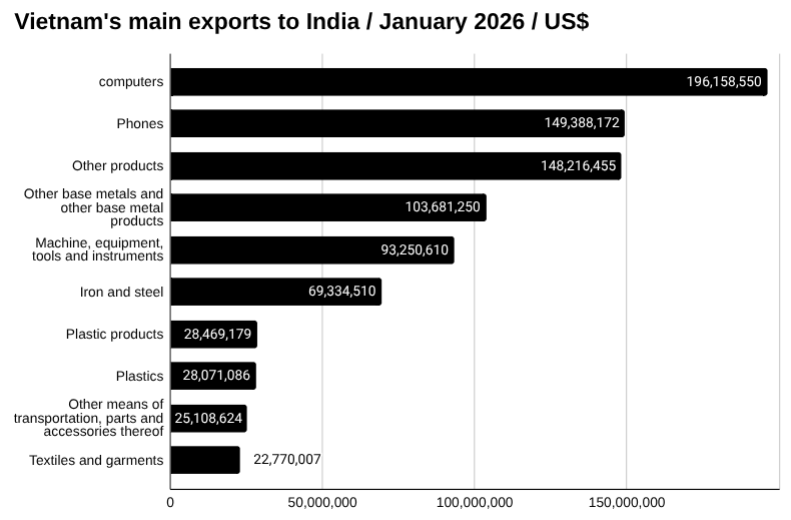
It also exported US$103.68 million worth of other base metals and other base metal products to India in January. This was up from US$102.45 million in December, a change of 1.20 percent.
Vietnam also exported US$93.25 million worth of machines, equipment, tools and instruments to India in January. This was up from US$86.67 million in December, a change of 7.59 percent.
Learn more about manufacturing in Vietnam→
Vietnam imports from India
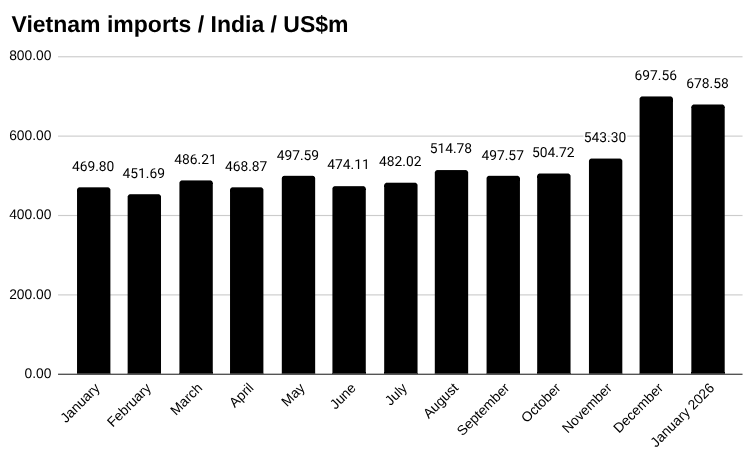
In January, Vietnam imported US$678.58 million worth of goods from India, down from US$697.56 million in December, a change of -2.72 percent, according to preliminary data from Vietnam’s General Department of Customs.
So far this year, Vietnam has imported US$679 million worth of goods from India. Read the full report…
Vietnam’s trade with India
In January, Vietnam imported goods worth US$678.58 million from India and exported US$994.90 million, bringing total trade to US$1,673.48 million and resulting in a trade surplus of US$316.31 million.
Two-way trade so far this year between Vietnam and India has reached US$1,673.48 million, with Vietnam importing US$678.58 million worth of goods and exporting US$994.90 million.
Discover more about trade in Vietnam→
Vietnam-India news
Recent developments in trade and investment between the two countries include:
India VN cosmetics firm acquisition
India’s Marico South-East Asia Corporation, a wholly owned unit of India’s Marico Limited, acquired 75 percent of Vietnam’s Skinetiq Joint Stock Company on February 9.
The transaction value was not disclosed.
Founded in 2020, Skinetiq is a Vietnamese direct-to-consumer cosmetics company and distributor of the Murad skincare products in Vietnam.”
India vs Vietnam textiles / garments
The India–European Union free trade agreement is expected to put India on an equal footing with Vietnam and Bangladesh in the European textile market by eliminating import duties, India’s commerce minister has said.
India previously faced tariffs of up to 12 percent on textile exports to Europe, while Vietnam and Bangladesh enjoyed zero duty under preferential trade arrangements.
Under the agreement, all Indian textile products will receive zero-duty access from day one.
See the latest Vietnam news headlines→
Vietnam-India trade relations
Vietnam and India established diplomatic relations in the 70s and elevated ties to a Comprehensive Strategic Partnership in 2016, expanding cooperation across trade, defence and energy.
Trade has been supported by the ASEAN India Free Trade Agreement in goods, which took effect in 2010, and subsequent agreements covering services and investment.
Bilateral turnover has grown steadily over the past decade, with both sides setting targets to raise two-way trade and diversify export structures.
Key traded items include electronics, machinery, agricultural products, petroleum and pharmaceuticals, alongside growing cooperation in oil and gas and renewable energy projects.
Explore starting a business in Vietnam→
The data
Vietnam trade with India year to date January US$m
| January | December | Change | YTD | |
| Imports | 678.58 | 697.56 | -2.72% | 678.58 |
| Exports | 994.90 | 993.63 | 0.13% | 994.90 |
| Total | 1,673.48 | 1,691.19 | -1.05% | 1,673.48 |
| Balance | 316.31 | 296.08 | 6.84% | 316.31 |
Vietnam exports to India in January US$m
| January | December | Change | YTD | |
| Total | 994.90 | 993.63 | 0.13% | 994.90 |
| computers | 196.16 | 210.99 | -7.03% | 196.16 |
| phones | 149.39 | 144.90 | 3.10% | 149.39 |
| other products | 148.22 | 133.59 | 10.95% | 148.22 |
| other base metals and other base metal products | 103.68 | 102.45 | 1.20% | 103.68 |
| machine, equipment, tools and instruments | 93.25 | 86.67 | 7.59% | 93.25 |
| iron and steel | 69.33 | 63.43 | 9.31% | 69.33 |
| plastic products | 28.47 | 27.25 | 4.46% | 28.47 |
| plastics | 28.07 | 13.47 | 108.33% | 28.07 |
| other means of transportation, parts and accessories thereof | 25.11 | 30.41 | -17.44% | 25.11 |
| textiles and garments | 22.77 | 26.14 | -12.89% | 22.77 |
| chemicals | 17.44 | 45.00 | -61.26% | 17.44 |
| textile and footwear materials | 16.20 | 17.99 | -9.98% | 16.20 |
| footwear | 15.76 | 14.16 | 11.31% | 15.76 |
| coffee | 14.24 | 6.34 | 124.47% | 14.24 |
| rubber | 12.88 | 10.37 | 24.12% | 12.88 |
| chemical products | 10.07 | 14.13 | -28.72% | 10.07 |
| iron and steel products | 8.11 | 10.40 | -22.06% | 8.11 |
| wood and wooden products | 7.71 | 9.25 | -16.63% | 7.71 |
| yarn | 6.70 | 5.65 | 18.73% | 6.70 |
| pepper | 6.04 | 5.60 | 7.87% | 6.04 |
| animal fodders and animal fodder materials | 4.93 | 3.02 | 63.61% | 4.93 |
| bamboo and rattan products | 3.85 | 3.45 | 11.43% | 3.85 |
| fishery products | 2.34 | 2.24 | 4.07% | 2.34 |
| rubber products | 1.95 | 2.20 | -11.40% | 1.95 |
| tea | 0.93 | 0.56 | 66.16% | 0.93 |
| ceramic products | 0.61 | 0.75 | -19.20% | 0.61 |
| pastry, sweets and cereals products | 0.42 | 0.47 | -10.58% | 0.42 |
| cashew nut | 0.29 | 2.73 | -89.50% | 0.29 |