
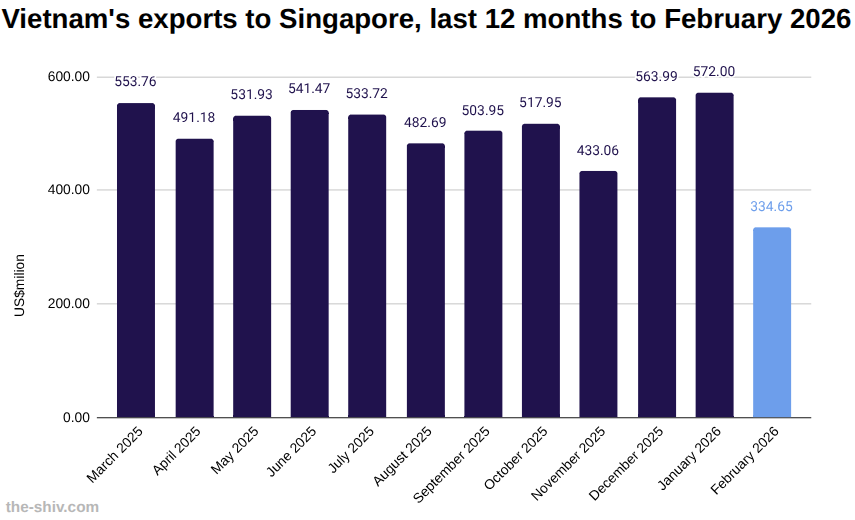
In February, Vietnam exported US$335 million worth of goods to Singapore, down 41.50 percent over January, according to preliminary data from Vietnam’s General Department of Customs.
Year to date, Vietnam had exported US$906 million worth of goods to Singapore by the end of February.
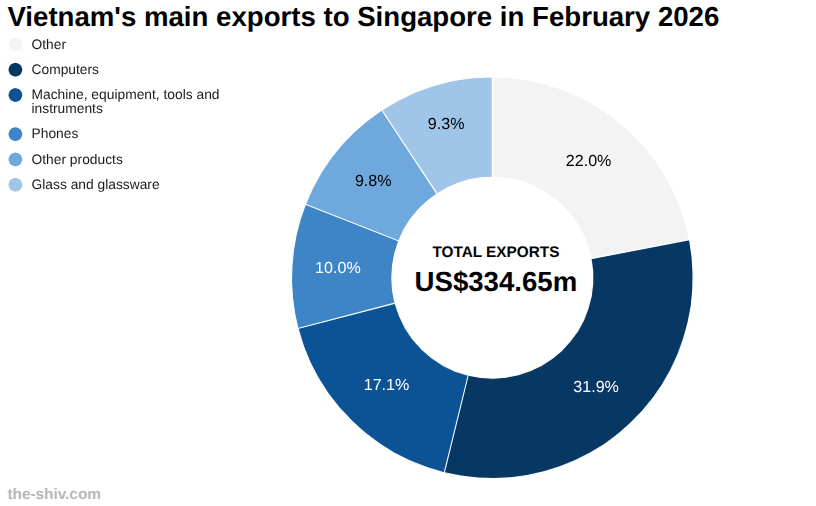
Vietnam exported US$106.67 million worth of computers to Singapore in February, down from US$186.60 million in January, a decline of 42.83 percent.
Machinery exports reached US$57.20 million while phones totalled US$33.57 million, with machinery down 33.89 percent and phones up 5.33 percent month on month.
Other products and glass exports stood at US$32.65 million and US$31.05 million, respectively, both recording declines of 30.73 percent and 43.54 percent.
Learn more about manufacturing in Vietnam→
Vietnam trade with Singapore YTD
In February, Vietnam imported US$578.54 million worth of goods from Singapore and exported US$334.65 million to Singapore, for total trade worth US$913.19 million, and leaving a trade deficit of US$243.90 million.
Two-way trade so far this year between Vietnam and Singapore has reached US$2,141 million, with Vietnam importing US$1,235 million worth of goods and exporting US$906 million worth of goods.
Discover more about trade in Vietnam→
Vietnam-Singapore news
Recent developments involving the two countries include:
Singapore firm acquires VN hotel chain
Singapore’s SC Capital Partners has acquired Vietnam’s Fusion Hotel Group.
Fusion will continue managing its properties, which include 18 hotels and about 3,000 rooms, alongside a 2,000-room pipeline. Read more→
See the latest Vietnam news headlines→
Vietnam-Singapore trade relations
Vietnam and Singapore maintain one of Southeast Asia’s most established trade and investment relationships, underpinned by strong bilateral agreements and regional frameworks.
Singapore is consistently among Vietnam’s largest foreign investors, with capital concentrated in manufacturing, real estate, and industrial park development.
Bilateral trade continues to grow, supported by supply chain integration, logistics connectivity, and agreements such as the Comprehensive and Progressive Agreement for Trans-Pacific Partnership and the Regional Comprehensive Economic Partnership.
Both countries are expanding cooperation into areas including digital economy, green energy, and financial services to support long term economic integration.
Explore starting a business in Vietnam→
The data
Vietnam trade with Singapore year to date February 2026 US$m
| February | January | Change | YTD | |
| Imports | 578.54 | 663.42 | -12.79% | 1,234.90 |
| Exports | 334.65 | 572.00 | -41.50% | 905.96 |
| Total | 913.19 | 1,235.43 | -26.08% | 2,140.86 |
| Balance | -243.90 | -91.42 | 166.77% | -328.94 |
Vietnam exports to Singapore in February 2026 US$m
| February | January | Change | YTD | |
| Total | 334.65 | 572.00 | -41.50% | 905.96 |
| Computers | 106.67 | 186.60 | -42.83% | 293.26 |
| Machine, equipment, tools and instruments | 57.20 | 86.52 | -33.89% | 143.72 |
| Phones | 33.57 | 31.87 | 5.33% | 65.44 |
| Other products | 32.65 | 47.13 | -30.73% | 79.57 |
| Glass and glassware | 31.05 | 54.99 | -43.54% | 86.04 |
| Other means of transportation, parts and accessories thereof | 13.82 | 85.98 | -83.93% | 99.80 |
| Petroleum products | 12.05 | 4.76 | 153.37% | 16.35 |
| Footwear | 7.47 | 9.06 | -17.48% | 16.53 |
| Fishery products | 5.78 | 10.43 | -44.53% | 16.21 |
| Textiles and garments | 4.17 | 7.62 | -45.23% | 11.79 |
| Other base metals and other base metal products | 3.60 | 2.87 | 25.59% | 6.47 |
| Iron and steel products | 3.58 | 4.39 | -18.47% | 7.97 |
| Rice | 3.42 | 4.79 | -28.65% | 8.21 |
| Fruits and vegetables | 3.23 | 5.91 | -45.30% | 9.14 |
| Insulated wires and cables | 2.81 | 7.03 | -60.02% | 9.84 |
| Chemical products | 1.98 | 2.51 | -20.97% | 4.49 |
| Wood and wood products | 1.85 | 3.92 | -52.91% | 5.77 |
| Iron and steel | 1.66 | 2.52 | -34.00% | 4.19 |
| Handbags, purses, suitcases, headgear and umbrellas | 1.58 | 2.77 | -43.18% | 4.35 |
| Paper and paper products | 1.57 | 2.57 | -38.84% | 4.14 |
| Plastic products | 1.13 | 1.70 | -33.39% | 2.83 |
| Toys and sporting goods | 1.11 | 1.29 | -14.07% | 2.40 |
| Pastry, sweets and cereals products | 0.90 | 1.77 | -48.92% | 2.67 |
| Coffee | 0.42 | 0.67 | -37.65% | 1.09 |
| Plastics | 0.36 | 0.44 | -19.70% | 0.80 |
| Pepper | 0.28 | 0.38 | -25.99% | 0.67 |
| Ceramic products | 0.28 | 0.36 | -22.60% | 0.63 |
| Rubber products | 0.27 | 0.38 | -29.19% | 0.65 |
| Cashew nut | 0.12 | 0.57 | -78.75% | 0.69 |
| Animal fodders and animal fodder materials | 0.05 | 0.19 | -74.24% | 0.24 |