
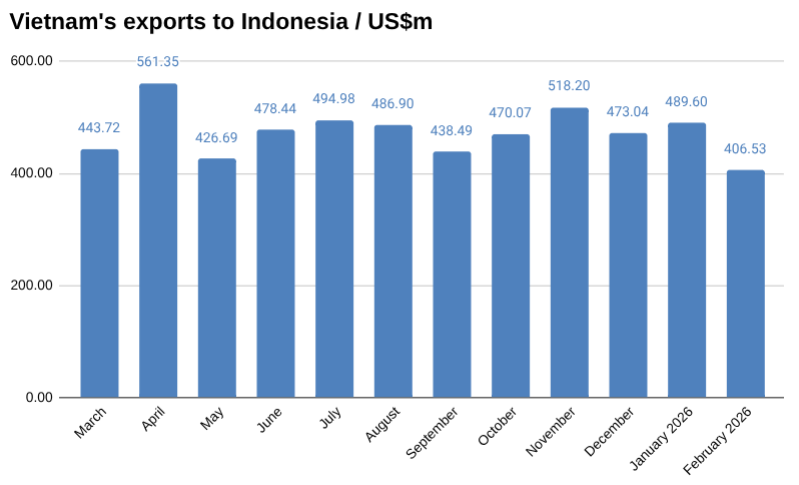
In February, Vietnam exported US$407 million worth of goods to Indonesia, down 16.97 percent over January, according to preliminary data from Vietnam’s General Department of Customs.
So far this year, Vietnam has exported US$896 million worth of goods to Indonesia.
Vietnam exported US$58.81 million worth of other means of transportation, parts and accessories thereof to Indonesia in February, up from US$18.77 million in January, a change of 213.28 percent.
It also exported US$50.42 million worth of other products to Indonesia in February, down from US$76.04 million in January, a change of -33.69 percent.
Adding to that, Vietnam exported US$39.55 million worth of textiles and garments to Indonesia in February, down from US$49.23 million in January, a change of -19.66 percent.
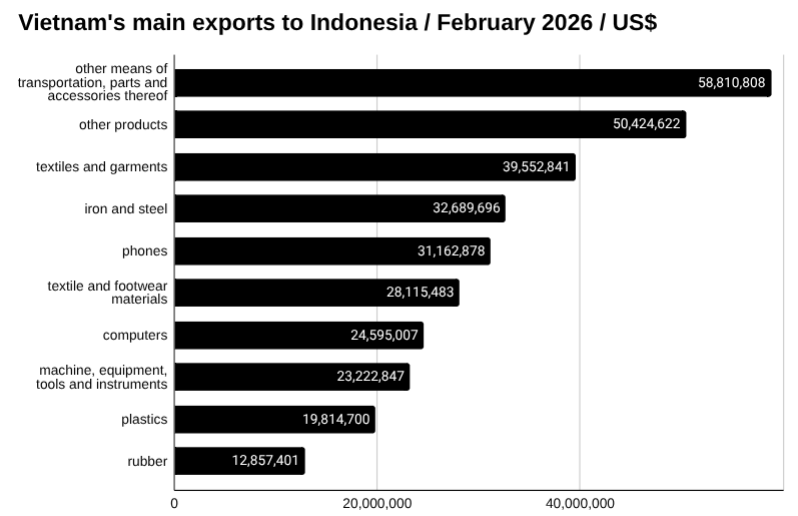
Vietnam exported US$32.69 million worth of iron and steel to Indonesia in February, up from US$29.44 million in January, a change of 11.02 percent.
It also exported US$31.16 million worth of phones to Indonesia in February, down from US$32.18 million in January, a change of -3.16 percent.
Learn more about manufacturing in Vietnam→
Vietnam’s trade with Indonesia
In February, Vietnam imported goods worth US$885.33 million from Indonesia and exported US$406.53 million, bringing total trade to US$1,291.86 million and resulting in a trade deficit of US$478.80 million.
Two-way trade so far this year between Vietnam and Indonesia has reached US$2,748.40 million, with Vietnam importing US$1,852.57 million worth of goods and exporting US$895.83 million.
Discover more about trade in Vietnam→
Vietnam-Indonesia news
US trade investigations
The United States announced new global trade investigations under Section 301 of the Trade Act of 1974 targeting China, Mexico, the European Union and more than a dozen other economies.
Countries named include Japan, India, South Korea, Singapore, Indonesia, Malaysia, Cambodia, Bangladesh, Thailand and Taiwan.
The investigations will examine policies linked to structural manufacturing overcapacity and alleged unfair trade practices. Read more→
Exports to Indonesia
In January, Vietnam exported US$490 million worth of goods to Indonesia, up 3.50 percent over December, according to preliminary data from Vietnam’s General Department of Customs. Read more→
See the latest Vietnam news headlines→
Vietnam-Indonesia trade relations
Vietnam and Indonesia established diplomatic relations in 1955 and upgraded ties to a Strategic Partnership in 2013, providing a framework for expanding trade, investment and economic cooperation.
Both countries are members of the Association of Southeast Asian Nations and participate in the ASEAN Free Trade Area, which has progressively reduced tariffs and streamlined customs procedures across the region.
Trade relations are also governed by broader regional agreements, including the Regional Comprehensive Economic Partnership, which entered into force in 2022 and further lowered trade barriers among ASEAN members and key partners.
Bilateral trade has expanded steadily over the past decade, with both governments setting targets to increase two-way trade through cooperation in manufacturing, agriculture, energy and maritime sectors.
Explore starting a business in Vietnam→
The data
Vietnam trade with Indonesia year to date February 2026 US$m
| February | January | Change | YTD | |
| Imports | 885.33 | 967.74 | -8.52% | 1,852.57 |
| Exports | 406.53 | 489.60 | -16.97% | 895.83 |
| Total | 1,291.86 | 1,457.34 | -11.35% | 2,748.40 |
| Balance | -478.80 | -478.14 | 0.14% | -956.74 |
Vietnam exports to Indonesia in February 2026 US$m
| February | January | Change | YTD | |
| Total | 406.53 | 489.60 | -16.97% | 895.83 |
| Other means of transportation, parts and accessories thereof | 58.81 | 18.77 | 213.28% | 77.58 |
| Other products | 50.42 | 76.04 | -33.69% | 126.49 |
| Textiles and garments | 39.55 | 49.23 | -19.66% | 88.79 |
| Iron and steel | 32.69 | 29.44 | 11.02% | 61.79 |
| Phones | 31.16 | 32.18 | -3.16% | 63.34 |
| Textile and footwear materials | 28.12 | 47.01 | -40.19% | 75.13 |
| Computers | 24.60 | 26.69 | -7.85% | 51.32 |
| Machine, equipment, tools and instruments | 23.22 | 36.56 | -36.49% | 59.75 |
| Plastics | 19.81 | 30.03 | -34.01% | 49.84 |
| Rubber | 12.86 | 19.32 | -33.43% | 32.17 |
| Coffee | 11.15 | 12.80 | -12.87% | 23.96 |
| Plastic products | 9.80 | 14.87 | -34.09% | 24.67 |
| Chemicals | 9.30 | 22.66 | -58.93% | 31.91 |
| Paper and paper products | 9.19 | 16.11 | -42.92% | 25.30 |
| Coal | 7.99 | 2.90 | 175.00% | 10.97 |
| Chemical products | 7.52 | 12.49 | -39.82% | 20.01 |
| Yarn | 6.81 | 9.32 | -26.90% | 16.14 |
| Footwear | 6.47 | 10.98 | -41.06% | 17.46 |
| Iron and steel products | 3.28 | 2.03 | 61.38% | 5.31 |
| Insulated wires and cables | 2.41 | 2.53 | -4.55% | 4.94 |
| Other base metals and other base metal products | 1.97 | 3.22 | -38.66% | 5.19 |
| Pastry, sweets and cereals products | 1.74 | 3.51 | -50.25% | 5.25 |
| Rubber products | 1.68 | 3.09 | -45.62% | 4.77 |
| Tyre cord fabrics and other fabrics for technical uses | 1.57 | 2.41 | -34.84% | 3.98 |
| Fruits and vegetables | 1.12 | 1.67 | -32.66% | 2.79 |
| Fishery products | 0.80 | 0.22 | 265.14% | 1.02 |
| Animal fodders and animal fodder materials | 0.56 | 0.96 | -41.90% | 1.52 |
| Petroleum products | 0.55 | 0.21 | 160.84% | 0.75 |
| Ores and other minerals product | 0.47 | 0.20 | 140.86% | 0.67 |
| Tea | 0.33 | 0.78 | -57.35% | 1.11 |
| Rice | 0.27 | 0.60 | -55.13% | 0.87 |
| Ceramic products | 0.22 | 0.64 | -65.41% | 0.86 |
| Non-wood furniture | 0.05 | 0.12 | -59.68% | 0.17 |