
In January, Vietnam exported US$2,530 million worth of goods to Japan, up 7.87 percent over December, according to preliminary data from Vietnam’s General Department of Customs.
So far this year, Vietnam has exported US$2,530 million worth of goods to Japan.

Vietnam exported US$347.89 million worth of textiles and garments to Japan in January. This was down from US$397.01 million in December, a change of -12.37 percent.
It also exported US$302.35 million worth of other means of transportation, parts and accessories thereof to Japan in January. This was up from US$290.16 million in December, a change of 4.20 percent.
Adding to that, Vietnam exported US$245.99 million worth of machines, equipment, tools and instruments to Japan in January. This was up from US$232.59 million in December, a change of 5.76 percent.
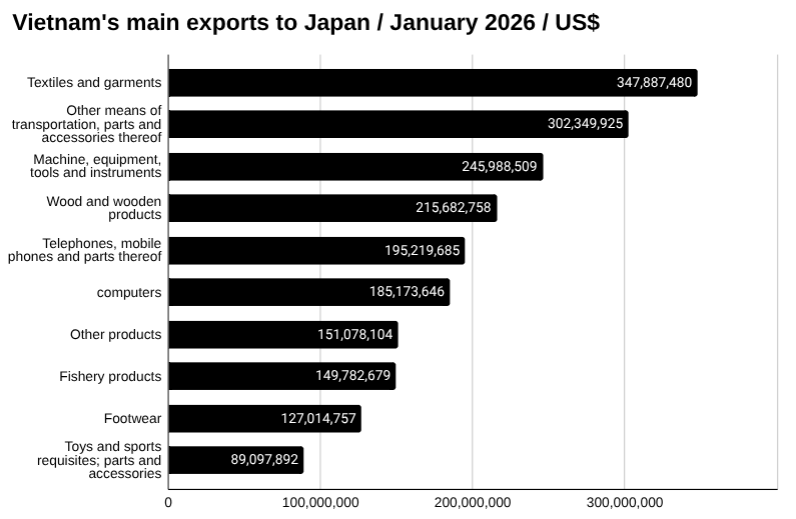
It also exported US$215.68 million worth of wood and wooden products to Japan in January. This was up from US$194.55 million in December, a change of 10.86 percent.
Vietnam also exported US$195.22 million worth of telephones, mobile phones and parts thereof to Japan in January. This was up from US$99.68 million in December, a change of 95.84 percent.
Learn more about manufacturing in Vietnam→
Vietnam trade with Japan
In January, Vietnam imported goods worth US$2,338.25 million from Japan and exported US$2,530.17 million, bringing total trade to US$4,868.41 million and resulting in a trade surplus of US$191.92 million.
Two-way trade so far this year between Vietnam and Japan has reached US$4,868.41 million, with Vietnam importing US$2,338.25 million worth of goods and exporting US$2,530.17 million.
Discover more about trade in Vietnam→
Vietnam-Japan news
Recent developments in trade and investment between the two countries include:
Mitsubishi real estate acquisition HCMC
Japan’s Mitsubishi Corporation has agreed to acquire the Thuan An 1 high-rise project from Phat Dat Real Estate Development for more than VND 1.9 trillion (US$72.1 million).
The 1.8-hectare project in Ho Chi Minh City includes 39 floors, three basement levels and about 2,700 apartments and shophouses, with land use rights granted in May 2025.
Japan firms competition China
A 2025 survey by Japan External Trade Organisation showed 30.8 percent of Japanese industrial firms in Vietnam identify Chinese companies as their main competitors, up from 24.6 percent in 2024.
The survey questioned 906 Japanese companies in Vietnam and found rising competition for labour, with 48.2 percent saying recruitment has become more difficult.
See the latest Vietnam news headlines→
See the latest Vietnam news headlines→
Vietnam-Japan trade relations
Vietnam and Japan have maintained close trade relations for decades, underpinned by Japan’s role as one of Vietnam’s largest trading partners, investors and providers of official development assistance.
Both countries are also members of the Comprehensive and Progressive Agreement for Trans-Pacific Partnership and the Regional Comprehensive Economic Partnership, reinforcing tariff reductions and supply chain integration.
Japan imports garments, seafood, furniture and electronics from Vietnam, while exporting machinery, automobiles, steel and high-tech components, reflecting complementary industrial structures and growing strategic economic cooperation.
Explore starting a business in Vietnam→
The data
Vietnam trade with Japan year to date January US$m
| January | December | Change | YTD | |
| Imports | 2,338.25 | 2,252.17 | 3.82% | 2,338.25 |
| Exports | 2,530.17 | 2,345.55 | 7.87% | 2,530.17 |
| Total | 4,868.41 | 4,597.72 | 5.89% | 4,868.41 |
| Balance | 191.92 | 93.38 | 105.53% | 191.92 |
Vietnam exports to Japan in January US$m
| January | December | Change | YTD | |
| Total | 2,530.17 | 2,345.55 | 7.87% | 2,530.17 |
| Textiles and garments | 347.89 | 397.01 | -12.37% | 347.89 |
| Other means of transportation, parts and accessories thereof | 302.35 | 290.16 | 4.20% | 302.35 |
| Machine, equipment, tools and instruments | 245.99 | 232.59 | 5.76% | 245.99 |
| Wood and wooden products | 215.68 | 194.55 | 10.86% | 215.68 |
| Telephones, mobile phones and parts thereof | 195.22 | 99.68 | 95.84% | 195.22 |
| computers | 185.17 | 183.82 | 0.73% | 185.17 |
| Other products | 151.08 | 140.63 | 7.43% | 151.08 |
| Fishery products | 149.78 | 129.91 | 15.30% | 149.78 |
| Footwear | 127.01 | 117.58 | 8.02% | 127.01 |
| Toys and sports requisites; parts and accessories | 89.10 | 56.27 | 58.33% | 89.10 |
| Coffee | 68.92 | 57.42 | 20.03% | 68.92 |
| Plastic products | 68.73 | 63.32 | 8.54% | 68.73 |
| Iron and steel products | 49.10 | 51.51 | -4.67% | 49.10 |
| Handbags, purses, suitcases, headgear and umbrellas | 44.40 | 50.42 | -11.93% | 44.40 |
| Chemicals | 43.93 | 42.10 | 4.36% | 43.93 |
| Insulated wires and cables | 35.04 | 34.94 | 0.28% | 35.04 |
| Other base metals and other base metal products | 29.55 | 31.51 | -6.24% | 29.55 |
| Fruits and vegetables | 20.44 | 17.14 | 19.26% | 20.44 |
| Plastics | 18.30 | 15.44 | 18.57% | 18.30 |
| Rubber products | 15.37 | 15.02 | 2.34% | 15.37 |
| Still image, video cameras and parts thereof | 14.76 | 12.88 | 14.65% | 14.76 |
| Pastry, sweets and cereals products | 14.66 | 12.68 | 15.63% | 14.66 |
| Chemical products | 12.92 | 13.09 | -1.31% | 12.92 |
| textile and footwear materials | 12.64 | 9.29 | 36.07% | 12.64 |
| Precious stones, precious metal and articles thereof | 9.97 | 8.51 | 17.23% | 9.97 |
| Cashew nut | 7.52 | 6.91 | 8.77% | 7.52 |
| Yarn | 7.48 | 7.48 | -0.06% | 7.48 |
| Ceramic products | 7.25 | 7.81 | -7.12% | 7.25 |
| Paper and paper products | 6.90 | 5.90 | 16.92% | 6.90 |
| Iron and steel | 6.71 | 5.42 | 23.92% | 6.71 |
| Bamboo and rattan products | 4.89 | 4.57 | 6.90% | 4.89 |
| Tyre cord fabrics and other fabrics for technical uses | 4.25 | 5.34 | -20.47% | 4.25 |
| Ores and other minerals product | 3.81 | 0.61 | 522.16% | 3.81 |
| Coal | 3.81 | 12.33 | -69.15% | 3.81 |
| Glass and glassware | 2.55 | 4.17 | -38.84% | 2.55 |
| Animal fodders and animal fodder materials | 2.27 | 1.63 | 38.84% | 2.27 |
| Rubber | 1.86 | 2.66 | -29.96% | 1.86 |
| Pepper | 1.35 | 1.79 | -24.37% | 1.35 |
| Manioc and manioc products | 0.94 | 1.03 | -8.71% | 0.94 |
| Fertilizers | 0.55 | 0.41 | 35.47% | 0.55 |
| Crude oil | 0.00 | 0.00 | 0.00% | 0.00 |