
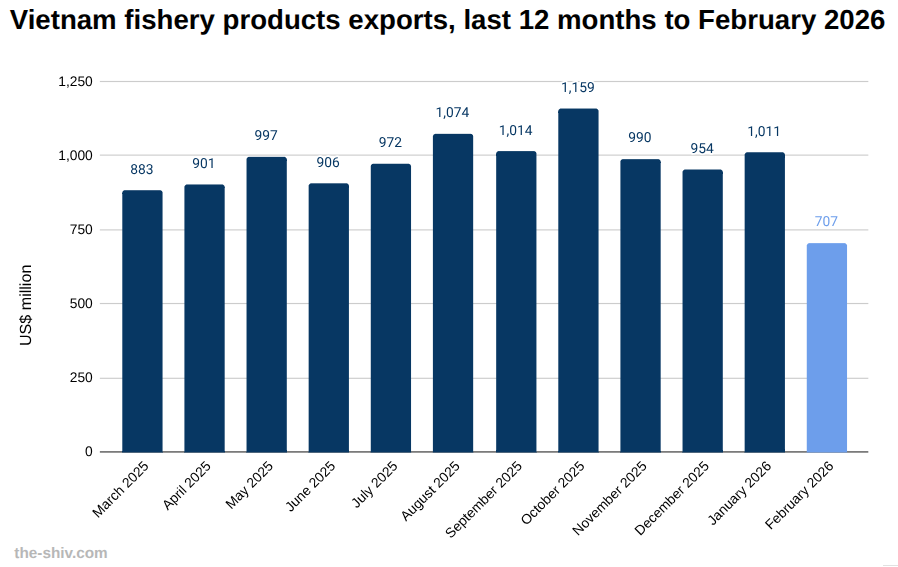
Vietnam exported fishery products to the tune of US$707 million in February, down from US$1,011 million in January, a change of -30.09 percent, according to preliminary data from Vietnam’s General Department of Customs.
Year to date, Vietnam had exported US$1,717 million worth of fishery products by the end of February.
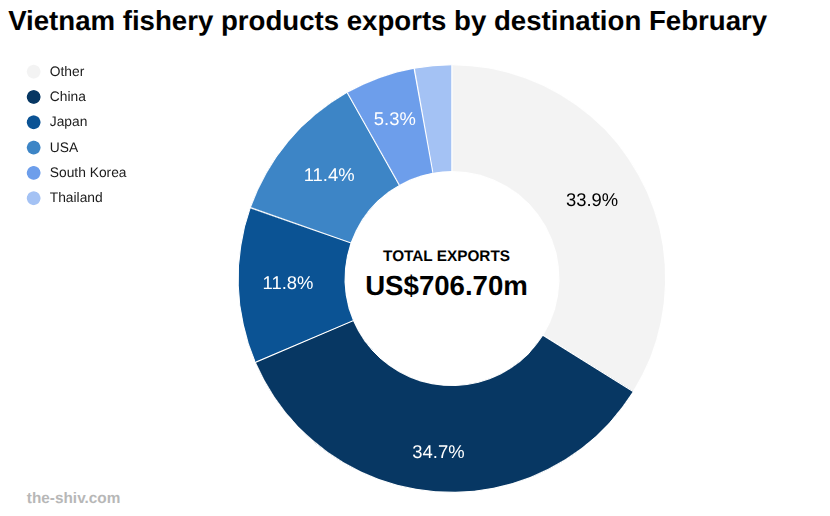
China led with US$245 million in February exports, up 0.31 percent from January, bringing year-to-date shipments to US$490 million.
Japan and the United States followed at US$83 million and US$81 million, down 44.35 percent and 37.00 percent, with year-to-date totals of US$233 million and US$209 million.
South Korea and Thailand recorded US$38 million and US$20 million, both declining over 45 percent, with year-to-date exports reaching US$114 million and US$57 million, respectively.
Learn more about manufacturing in Vietnam→
Listed seafood companies
Key seafood firms listed on the Vietnam stock exchange include:
Ben Tre Aquaproduct Import and Export JSC (ABT)
Ben Tre Aquaproduct Import and Export JSC (ABT) processes and exports frozen seafood products such as clams, shrimp, and pangasius, primarily to European and Asian markets. (ABT)
In February, ABT shares moved from 64.10 to 66.50, a change of 2.40 (0.04 percent).
Foreign ownership moved from 69,138.24 to 69,130.25, a change of -7.99 (0.00 percent).
Sao Mai Group Corporation (ASM)
Sao Mai Group Corporation (ASM) operates in seafood processing, real estate, and renewable energy, notably solar power projects in southern Vietnam. (ASM)
In February, ASM shares moved from 6.32 to 6.30, a change of -0.02 (0.00 percent).
Foreign ownership moved from 1,483,077.50 to 1,482,835.44, a change of -242.06 (0.00 percent).
Sao Ta Foods JSC (FMC)
Sao Ta Foods JSC (FMC) farms, processes, and exports shrimp and frozen seafood products mainly to Japan and the US. (FMC)
In February, FMC shares moved from 37.65 to 43.00, a change of 5.35 (0.14 percent).
Foreign ownership moved from 124,045.85 to 124,929.35, a change of 883.50 (0.01 percent).
Dong Phuoc Fishery JSC (VDP)
Dong Phuoc Fishery JSC (VDP) processes and exports frozen seafood products such as pangasius fillets and shrimp. (VDP)
In February, VDP shares moved from 47.90 to 50.00, a change of 2.10 (0.04 percent).
Foreign ownership moved from 220,452.31 to 220,453.31, a change of 1.00 (0.00 percent).
Explore opening a trading account in Vietnam→
Vietnam fishery products news
Recent developments in fishery products in Vietnam include:
Seafood exports
Vietnam exported fishery products to the tune of US$1,011 million in January, up from US$954 million in December, a change of 5.92 percent, according to preliminary data from Vietnam’s General Department of Customs. Read more→
Aquaculture feed production in February
Vietnam produced 814.21 thousand tonnes of aquaculture feed in February, up 12.22 percent from 725.52 thousand tonnes in January, according to the latest data from the National Statistics Office. Read more→
Thai aquaculture development in VN
Thai Pacific Aquaculture, PC Farm, and Unity Agro Intertrade said at the 2026 VietShrimp Asia and Aquaculture Vietnam show they are expanding beyond Thailand into Vietnam’s aquaculture sector.
The companies identified growth opportunities in shrimp genetics, tilapia broodstock, and water treatment, citing Vietnam’s rapid industry development and openness to new technologies. Read more→
Processed seafood output in February
Vietnam produced 643.78 thousand tonnes of processed seafood in February, up 8.14 percent from 595.34 thousand tonnes in January, according to the latest data from the National Statistics Office. Read more→
See the latest Vietnam news headlines→
Vietnam’s fishery products industry
Vietnam’s fishery products industry is a major export sector, supplying global markets with shrimp, pangasius, tuna, and other seafood products.
The sector is supported by extensive aquaculture development and a large coastal fishing industry, particularly in the Mekong Delta.
Exports are influenced by global demand, trade regulations, and compliance requirements in key markets such as the United States and the European Union.
Producers are investing in traceability, sustainability standards, and processing capacity to maintain competitiveness and meet international requirements.
Find out about starting a business in Vietnam→
The data
Vietnam exports of fishery products in February, 2026 US$m
| February | January | MoM | YTD | |
| Total | 706.70 | 1,010.80 | -30.09% | 1,717.47 |
| Other | 15.35 | 22.57 | -32.00% | 37.90 |
| China | 245.37 | 244.61 | 0.31% | 489.96 |
| Japan | 83.36 | 149.78 | -44.35% | 233.14 |
| USA | 80.91 | 128.41 | -37.00% | 209.32 |
| South Korea | 37.69 | 76.73 | -50.88% | 114.42 |
| Thailand | 20.03 | 36.52 | -45.17% | 56.55 |
| Australia | 19.62 | 31.78 | -38.24% | 51.40 |
| UK | 19.20 | 24.92 | -22.96% | 44.12 |
| Canada | 15.70 | 19.35 | -18.84% | 35.05 |
| Brazil | 14.63 | 26.73 | -45.26% | 41.37 |
| Germany | 13.78 | 20.83 | -33.84% | 34.61 |
| Russia | 12.77 | 15.55 | -17.90% | 28.31 |
| Netherlands | 11.26 | 17.87 | -36.97% | 29.13 |
| Hong Kong | 8.50 | 15.31 | -44.46% | 23.81 |
| Belgium | 8.37 | 12.78 | -34.52% | 21.15 |
| Taiwan | 8.22 | 21.46 | -61.70% | 29.68 |
| Mexico | 7.52 | 14.16 | -46.85% | 21.68 |
| Philippines | 7.25 | 12.27 | -40.92% | 19.52 |
| Israel | 6.07 | 4.37 | 38.89% | 10.44 |
| Malaysia | 5.91 | 14.42 | -59.04% | 20.33 |
| Singapore | 5.78 | 10.43 | -44.53% | 16.21 |
| Spain | 5.23 | 8.41 | -37.86% | 13.64 |
| Colombia | 4.89 | 7.07 | -30.82% | 11.96 |
| Austria | 4.11 | 0.00 | 0.00% | 10.48 |
| Italy | 3.69 | 7.15 | -48.46% | 10.84 |
| Portugal | 3.57 | 4.24 | -15.79% | 7.82 |
| Egypt | 3.52 | 5.68 | -37.94% | 9.20 |
| UAE | 3.42 | 4.99 | -31.44% | 8.41 |
| France | 3.25 | 5.14 | -36.75% | 8.39 |
| Denmark | 2.91 | 4.04 | -28.03% | 6.95 |
| Lithuania | 2.72 | 4.23 | -35.63% | 6.95 |
| Poland | 2.33 | 4.64 | -49.82% | 6.97 |
| Sweden | 2.23 | 2.36 | -5.53% | 4.58 |
| Romania | 1.99 | 1.42 | 39.54% | 3.41 |
| Cambodia | 1.86 | 2.51 | -25.78% | 4.37 |
| New Zealand | 1.81 | 2.69 | -32.73% | 4.49 |
| Iraq | 1.40 | 3.16 | -55.73% | 4.55 |
| Chile | 1.35 | 2.45 | -45.13% | 3.80 |
| Peru | 1.11 | 1.62 | -31.23% | 2.73 |
| Ukraine | 1.05 | 1.11 | -5.12% | 2.16 |
| India | 1.04 | 2.34 | -55.54% | 3.37 |
| Pakistan | 1.00 | 0.90 | 11.72% | 1.90 |
| Switzerland | 0.93 | 1.65 | -43.70% | 2.58 |
| Norway | 0.82 | 1.22 | -32.32% | 2.04 |
| Indonesia | 0.80 | 0.22 | 265.14% | 1.02 |
| Cyprus | 0.73 | 1.09 | -32.82% | 1.81 |
| Greece | 0.65 | 1.02 | -36.09% | 1.68 |
| Kuwait | 0.47 | 0.49 | -4.50% | 0.97 |
| Czech Republic | 0.17 | 0.04 | 307.17% | 0.21 |
| Angola | 0.11 | 0.13 | -15.05% | 0.24 |
| Turkey | 0.10 | 0.45 | -77.39% | 0.55 |
| Sri Lanka | 0.08 | 0.04 | 86.03% | 0.12 |
| Algeria | 0.05 | 0.30 | -84.14% | 0.35 |
| Brunei Darussalam | 0.04 | 0.13 | -69.84% | 0.16 |
| Belarus | 0.00 | 0.07 | -100.00% | 0.07 |
| Panama | 0.00 | 0.62 | -100.00% | 0.62 |
| Saudi Arabia | 0.00 | 6.37 | -100.00% | 0.00 |