
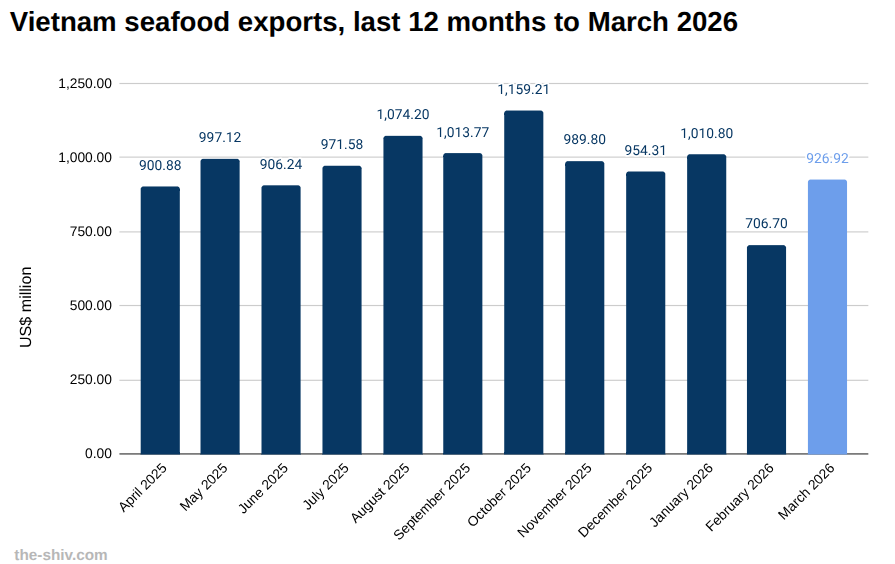
Vietnam exported seafood to the tune of US$927 million in March, up from US$707 million in February, a change of 31.16 percent, according to preliminary data from Vietnam’s General Department of Customs.
Year to date, Vietnam exported US$2,644 million worth of seafood by the end of March.
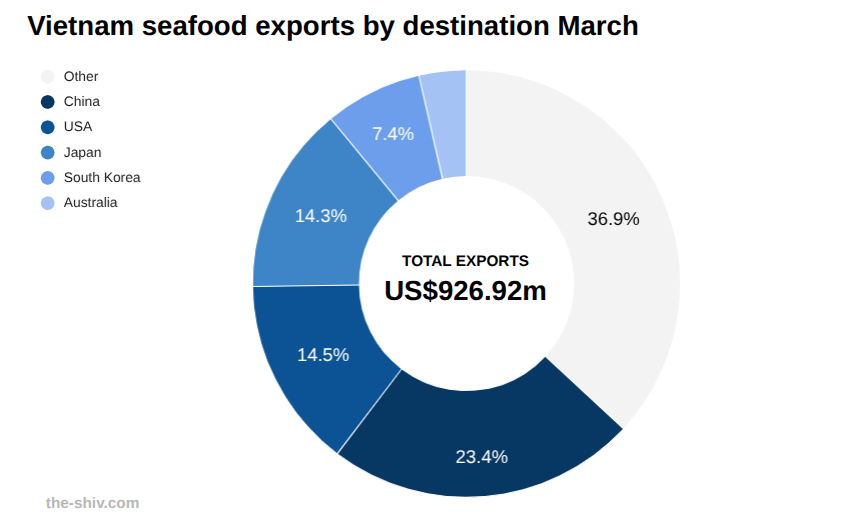
China led in March with US$217 million, down from US$245 million in February, a decline of 11.44 percent, with year-to-date exports reaching US$707 million.
The United States and Japan followed with US$134 million and US$132 million, respectively, rising from US$81 million and US$83 million, increases of 65.57 percent and 58.62 percent.
South Korea and Australia rounded out the top five with US$68 million and US$33 million, both up from February, with year-to-date totals of US$183 million and US$85 million.
Learn more about manufacturing in Vietnam→
Listed seafood companies
Key seafood firms listed on the Vietnam stock exchange include:
Ben Tre Aquaproduct Import and Export JSC (ABT)
Ben Tre Aquaproduct Import and Export JSC (ABT) processes and exports frozen seafood products such as clams, shrimp, and pangasius, primarily to European and Asian markets. (ABT)
In March, ABT shares moved from 66.50 to 60.80, a change of -5.70 (-8.57%).
Foreign ownership moved from 69,130.25 to 69,131.25, a change of 1.00 (0.00%).
Sao Mai Group Corporation (ASM)
Sao Mai Group Corporation (ASM) operates in seafood processing, real estate, and renewable energy, notably solar power projects in southern Vietnam. (ASM)
In March, ASM shares moved from 6.30 to 5.68, a change of -0.62 (-9.84%).
Foreign ownership moved from 1,482,835.44 to 1,483,692.34, a change of 856.90 (0.06%).
Sao Ta Foods JSC (FMC)
Sao Ta Foods JSC (FMC) farms, processes, and exports shrimp and frozen seafood products mainly to Japan and the US. (FMC)
In March, FMC shares moved from 43.00 to 38.45, a change of -4.55 (-10.58%).
Foreign ownership moved from 124,929.35 to 123,549.85, a change of -1,379.50 (-1.10%).
Dong Phuoc Fishery JSC (VDP)
Dong Phuoc Fishery JSC (VDP) processes and exports frozen seafood products such as pangasius fillets and shrimp. (VDP)
In March, VDP shares moved from 50.00 to 0.00, a change of -50.00 (-100.00%).
Foreign ownership moved from 220,453.31 to 220,456.31, a change of 3.00 (0.00%).
Explore opening a trading account in Vietnam→
Vietnam seafood news
Recent developments in seafood in Vietnam include:
Seafood sector challenges on provincial merger
Nguyen Van Do, chairman of the Ca Mau Seafood Processing and Export Association, has said administrative changes after the provincial mergers last year left farming areas off quality monitoring lists, blocking export certification and triggering order cancellations.
Ngo Minh Hien, chief executive of SEANAMICO, said the company lost orders of more than 30.6 tonnes worth over VND20 billion (US$758,993) and risks further cancellations. Read more→
Processed seafood output in February
Vietnam produced 643.78 thousand tonnes of processed seafood in February, up 8.14 percent from 595.34 thousand tonnes in January, according to the latest data from the National Statistics Office. Read more→
See the latest Vietnam news headlines→
Vietnam’s seafood industry
Vietnam’s seafood industry is a major export sector, supplying global markets with shrimp, pangasius, tuna, and other seafood products.
The sector is supported by extensive aquaculture development and a large coastal fishing industry, particularly in the Mekong Delta.
Exports are influenced by global demand, trade regulations, and compliance requirements in key markets such as the United States and the European Union.
Producers are investing in traceability, sustainability standards, and processing capacity to maintain competitiveness and meet international requirements.
Find out about starting a business in Vietnam→
The data
Vietnam exports of seafood in March, 2026 US$m
| March | February | MoM | YTD | |
| Total | 926.92 | 706.70 | 31.16% | 2,644.42 |
| Other | 20.34 | 26.73 | -23.92% | 68.35 |
| China | 217.29 | 245.37 | -11.44% | 707.05 |
| USA | 133.96 | 80.91 | 65.57% | 343.28 |
| Japan | 132.22 | 83.36 | 58.62% | 365.37 |
| South Korea | 68.36 | 37.69 | 81.38% | 182.78 |
| Australia | 33.18 | 19.62 | 69.09% | 84.58 |
| Thailand | 30.04 | 20.03 | 49.99% | 86.58 |
| Canada | 27.68 | 15.70 | 76.25% | 62.73 |
| UK | 23.77 | 19.20 | 23.83% | 67.89 |
| Russia | 20.16 | 12.77 | 57.93% | 48.47 |
| Netherlands | 19.93 | 11.26 | 77.02% | 49.06 |
| Brazil | 19.18 | 14.63 | 31.06% | 60.55 |
| Taiwan | 16.49 | 8.22 | 100.64% | 46.18 |
| Germany | 14.77 | 13.78 | 7.22% | 49.38 |
| Hong Kong | 13.55 | 8.50 | 59.36% | 37.36 |
| Belgium | 12.15 | 8.37 | 45.25% | 33.30 |
| Malaysia | 11.74 | 5.91 | 98.83% | 32.07 |
| Philippines | 10.82 | 7.25 | 49.22% | 30.33 |
| Singapore | 10.04 | 5.78 | 73.58% | 26.25 |
| Spain | 8.38 | 5.23 | 60.39% | 22.02 |
| Mexico | 8.06 | 7.52 | 7.15% | 29.74 |
| Saudi Arabia | 6.21 | 0.00 | 0.00% | 16.69 |
| Colombia | 0.00 | 0.00 | 26.26% | 18.13 |
| Israel | 6.09 | 6.07 | 0.41% | 16.53 |
| Italy | 5.54 | 3.69 | 50.10% | 16.38 |
| France | 5.12 | 3.25 | 57.47% | 13.51 |
| Denmark | 4.60 | 2.91 | 58.21% | 11.55 |
| Poland | 4.54 | 2.33 | 95.10% | 11.52 |
| Argentina | 4.22 | 0.00 | 0.00% | 13.42 |
| Portugal | 3.81 | 3.57 | 6.50% | 11.62 |
| Switzerland | 3.36 | 0.93 | 261.69% | 5.95 |
| New Zealand | 3.04 | 1.81 | 68.27% | 7.53 |
| Sweden | 2.59 | 2.23 | 16.40% | 7.18 |
| Lithuania | 2.40 | 2.72 | -11.92% | 9.34 |
| Norway | 2.32 | 0.82 | 181.25% | 4.36 |
| Cambodia | 1.93 | 1.86 | 3.55% | 6.29 |
| Peru | 1.79 | 1.11 | 60.90% | 4.53 |
| Romania | 1.76 | 1.99 | -11.68% | 5.17 |
| Chile | 1.72 | 1.35 | 27.40% | 5.52 |
| Ukraine | 0.00 | 0.00 | 46.78% | 3.70 |
| India | 1.39 | 1.04 | 33.70% | 4.76 |
| Greece | 1.36 | 0.65 | 107.42% | 3.04 |
| Indonesia | 1.26 | 0.80 | 56.37% | 2.28 |
| Turkey | 0.91 | 0.10 | 804.21% | 1.46 |
| Czech Republic | 0.44 | 0.17 | 163.18% | 0.65 |
| UAE | 0.26 | 3.42 | -92.37% | 8.67 |
| Brunei Darussalam | 0.22 | 0.04 | 478.77% | 0.38 |
| Sri Lanka | 0.09 | 0.08 | 16.73% | 0.21 |
| Senegal | 0.07 | 0.00 | 0.00% | 0.07 |
| Panama | 0.00 | 0.00 | 0.00% | 0.68 |