
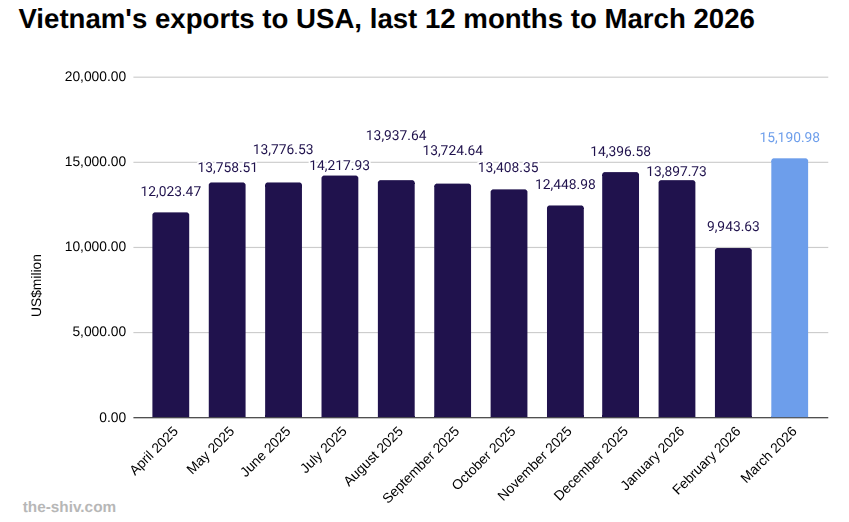
In March, Vietnam exported US$15,191 million worth of goods to the USA, up 52.77 percent over February, according to preliminary data from Vietnam’s General Department of Customs.
So far this year, Vietnam has exported US$39,033 million worth of goods to the United States, led by strong growth across key manufacturing categories.
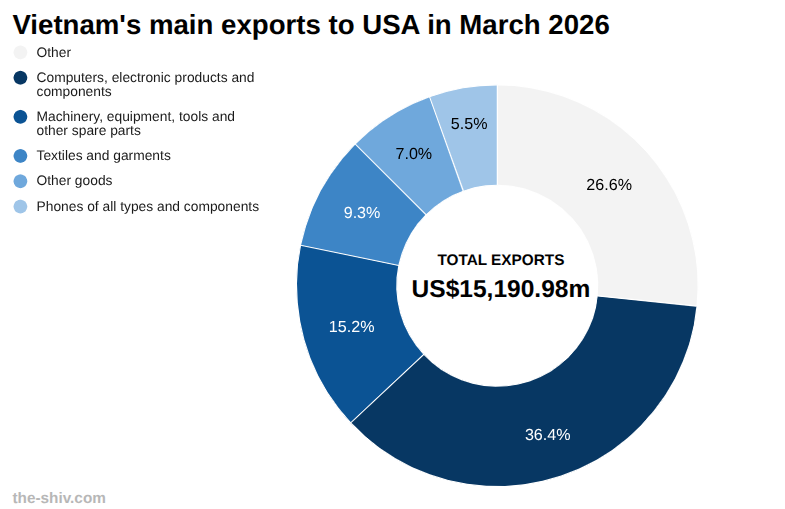
Computers, electronic products and components reached US$5,530.92 million in March, up 81.80 percent from February’s US$3,042.26 million.
Machinery, equipment, tools and spare parts totalled US$2,307.75 million, rising 52.88 percent, while textiles and garments reached US$1,405.64 million, up 27.21 percent.
Other goods and phones recorded US$1,068.80 million and US$833.53 million, respectively, increasing 53.63 percent and 4.36 percent month on month.
Learn more about manufacturing in Vietnam→
Vietnam trade with USA YTD
In March, Vietnam imported US$1,772.51 million worth of goods from USA and exported US$15,190.98 million to USA, for total trade worth US$16,963.49 million, and leaving a trade surplus of US$13,418.48 million.
Two-way trade so far this year between Vietnam and USA has reached US$44,168 million, with Vietnam importing US$5,136 million worth of goods and exporting US$39,033 million worth of goods.
Discover more about trade in Vietnam→
Vietnam-USA news
Recent developments involving the two countries include:
MoIT on US trade investigations
Nguyen Quynh Mai, deputy director general of the Multilateral Trade Policy Department, has responded to recently announced US investigations by pointing out that it covers other major economies, including the European Union, Japan, South Korea and Singapore.
He also said that Nguyen Sinh Nhat Tan said Vietnam and the United States have completed six rounds of tariff negotiations, with most positions aligned but some issues unresolved. Read more→
Trade ministry industry warnings trade investigations
Vietnam’s Ministry of Industry and Trade warned that exports worth US$3.4 billion, mainly wooden-framed sofas, face the risk of United States trade investigations.
The United States has imposed anti-dumping and countervailing duties on similar Chinese products, increasing scrutiny on Vietnam as a major supplier with a rising market share, the article says. Read more→
See the latest Vietnam news headlines→
Vietnam-USA trade relations
Vietnam–United States trade relations have expanded rapidly, making the US Vietnam’s largest export market and a key driver of bilateral economic ties.
Trade is heavily weighted toward Vietnamese exports, particularly electronics, textiles, footwear, and furniture, reflecting Vietnam’s role in global manufacturing supply chains.
The relationship has deepened through investment flows, supply chain diversification, and growing cooperation in technology, energy, and services.
Ongoing challenges include trade imbalances, regulatory differences, and evolving US trade policy, though both sides continue to pursue closer economic alignment.
Explore starting a business in Vietnam→
The data
Vietnam trade with the USA year to date March 2026 US$m
| March | February | Change | YTD | |
| Imports | 1,772.51 | 1,462.43 | 21.20% | 5,135.56 |
| Exports | 15,190.98 | 9,943.63 | 52.77% | 39,032.66 |
| Total | 16,963.49 | 11,406.06 | 48.72% | 44,168.22 |
| Balance | 13,418.48 | 8,481.19 | 58.21% | 33,897.10 |
Vietnam exports to the USA in March 2026 US$m
| March | February | Change | YTD | |
| Total | 15,190.98 | 9,943.63 | 52.77% | 39,032.66 |
| Computers, electronic products and components | 5,530.92 | 3,042.26 | 81.80% | 12,363.14 |
| Machinery, equipment, tools and other spare parts | 2,307.75 | 1,509.51 | 52.88% | 6,142.34 |
| Textiles and garments | 1,405.64 | 1,104.97 | 27.21% | 3,928.17 |
| Other goods | 1,068.80 | 695.71 | 53.63% | 2,999.74 |
| Phones of all types and components | 833.53 | 798.71 | 4.36% | 2,672.35 |
| Footwear of all kinds | 764.91 | 563.83 | 35.66% | 2,150.73 |
| Wood and wood products | 697.55 | 452.22 | 54.25% | 1,958.40 |
| Transportation vehicles and spare parts | 387.23 | 0.00 | 0.00% | 979.34 |
| Plastic products | 341.12 | 228.48 | 49.30% | 927.67 |
| Toys, sporting goods and parts | 325.74 | 236.24 | 37.89% | 918.66 |
| Handbags, wallets, suitcases, hats, umbrellas. | 179.56 | 134.01 | 33.99% | 494.00 |
| Cameras, camcorders, and accessories | 161.95 | 94.67 | 71.07% | 393.73 |
| Iron and steel products | 147.93 | 100.07 | 47.83% | 393.34 |
| Electrical wires and cables | 143.45 | 96.52 | 48.62% | 391.04 |
| Seafood | 133.96 | 80.91 | 65.57% | 343.28 |
| Cashew | 97.92 | 40.90 | 139.42% | 221.18 |
| Coffee | 89.46 | 46.90 | 90.74% | 196.92 |
| Paper and paper products | 75.59 | 48.69 | 55.25% | 188.43 |
| Iron and steel of all kinds | 67.52 | 87.99 | -23.27% | 259.88 |
| Pepper | 62.61 | 26.83 | 133.39% | 128.28 |
| Rubber products | 55.25 | 46.41 | 19.06% | 165.11 |
| Fruits and vegetables | 50.55 | 30.96 | 63.30% | 130.05 |
| Products made from rattan, bamboo, sedge, and mats. | 37.70 | 25.50 | 47.83% | 107.53 |
| Glass and glass products | 31.03 | 23.79 | 30.43% | 86.78 |
| Confectionery and cereal products | 30.70 | 11.50 | 166.89% | 57.30 |
| Gemstones, precious metals and products | 29.04 | 20.57 | 41.18% | 75.52 |
| Raw materials for textiles, garments, leather, and footwear. | 20.25 | 14.22 | 42.41% | 58.90 |
| Fibers and yarns of all kinds | 19.41 | 9.85 | 97.00% | 45.32 |
| Curtain fabrics, other technical fabrics | 16.91 | 0.00 | 0.00% | 49.19 |
| Ceramic products | 16.11 | 13.56 | 18.80% | 47.78 |
| Chemical products | 15.36 | 10.58 | 45.22% | 45.45 |
| Other common metals | 15.27 | 63.70 | -76.03% | 39.58 |
| Chemicals | 11.62 | 6.40 | 81.61% | 23.58 |
| Animal feed and raw materials | 8.95 | 0.00 | 0.00% | 26.79 |
| Rubber | 5.06 | 4.05 | 24.85% | 13.31 |
| Rice | 3.38 | 1.59 | 113.34% | 7.05 |
| Tea | 1.27 | 0.95 | 33.82% | 2.80 |
| Transportation vehicles and parts; other goods | 0.00 | 248.51 | -100.00% | 0.00 |