
Vietnam exported textiles and garments to the tune of US$3,156 million in March, up from US$2,426 million in February, a change of 30.07 percent, according to preliminary data from Vietnam’s General Department of Customs.
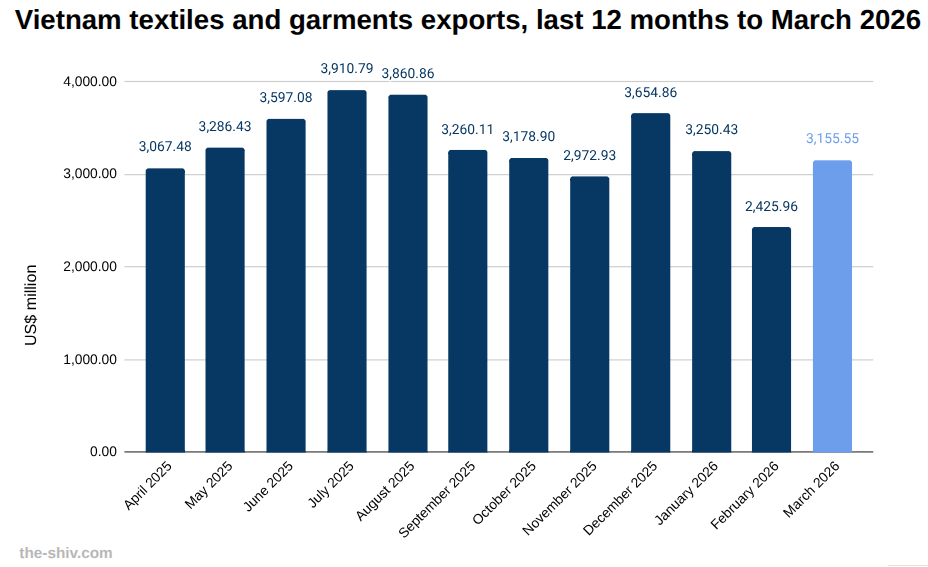
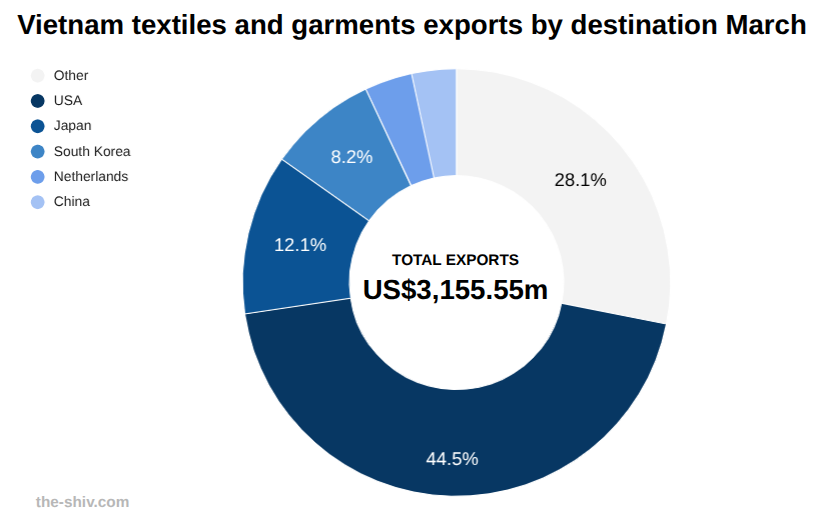
Year to date, Vietnam exported US$8,863 million worth of textiles and garments by the end of March, with the United States remaining the largest market.
The United States recorded US$1,406 million in March exports, up 27.21 percent month on month, bringing year-to-date shipments to US$3,928 million.
Japan, South Korea and the Netherlands all posted strong monthly growth, with exports reaching US$383 million, US$260 million and US$114 million respectively in March.
China rounded out the top five at US$106 million in March, with year-to-date exports to these key markets reflecting broad-based demand growth.
Learn more about manufacturing in Vietnam→
Listed textiles and garments companies
Key textiles and garments firms listed on the Vietnam stock exchange include:
Song Hong Garment JSC (MSH)
Song Hong Garment JSC (MSH) manufactures and exports garments and textiles for global fashion brands. (MSH)
In March, MSH shares moved from 39.25 to 37.60, a change of -1.65 (-4.20%).
Foreign ownership moved from 484,084.05 to 476,338.70, a change of -7,745.35 (-1.60%).
Binh Thanh Import Export Production and Trade JSC (GIL)
Binh Thanh Import Export Production and Trade JSC (GIL) manufactures and exports garments, backpacks, and home goods. (GIL)
In March, GIL shares moved from 15.00 to 13.40, a change of -1.60 (-10.67%).
Foreign ownership moved from 493,996.99 to 494,413.81, a change of 416.82 (0.08%).
Thanh Cong Textile Garment Investment Trading JSC (TCM)
Thanh Cong Textile Garment Investment Trading JSC (TCM) manufactures and exports garments, yarn, and textiles. (TCM)
In March, TCM shares moved from 26.70 to 22.95, a change of -3.75 (-14.04%).
Foreign ownership moved from 16,905.26 to 18,069.20, a change of 1,163.94 (6.89%).
Explore opening a trading account in Vietnam→
Vietnam textiles and garments news
Recent developments in textiles and garments in Vietnam include:
Garment sector push for imported textile scrap
Phan Thi Thanh Xuan, Vice Chairwoman and General Secretary of the Vietnam Leather, Footwear and Handbag Association, has warned firms risk losing contracts worth tens of millions of US dollars without recycled inputs.
Phan Thi Thanh Xuan said imported textile scrap could provide low-cost materials for recycling to support production amid rising cost pressures. Read more→
See the latest Vietnam news headlines→
Vietnam’s textiles and garments industry
Vietnam’s textiles and garments industry is a major export sector, supplying global markets including the United States, the European Union and Japan.
The industry is driven by foreign direct investment and integrated supply chains, though it remains reliant on imported raw materials such as fabrics and yarns.
Key advantages include competitive labour costs and participation in free trade agreements, which support export growth and market access.
However, the sector faces pressure from rising input costs, stricter sustainability standards and increasing competition from other regional manufacturing hubs.
Find out about starting a business in Vietnam→
The data
Vietnam exports of textiles and garments in March, 2026 US$m
| March | February | MoM | YTD | |
| Total | 3,155.55 | 2,425.96 | 30.07% | 8,863.47 |
| Other | 39.70 | 35.75 | 11.05% | 151.95 |
| USA | 1,405.64 | 1,104.97 | 27.21% | 3,928.17 |
| Japan | 383.11 | 268.99 | 42.42% | 999.99 |
| South Korea | 260.01 | 210.32 | 23.62% | 735.21 |
| Netherlands | 113.59 | 85.17 | 33.37% | 300.73 |
| China | 106.28 | 83.48 | 27.31% | 328.80 |
| Canada | 95.96 | 63.42 | 51.30% | 242.90 |
| Cambodia | 85.79 | 56.92 | 50.74% | 231.44 |
| UK | 69.93 | 59.46 | 17.60% | 205.81 |
| Germany | 61.79 | 39.29 | 57.25% | 164.69 |
| Indonesia | 55.43 | 39.55 | 40.14% | 144.22 |
| Australia | 50.59 | 45.92 | 10.17% | 158.67 |
| Spain | 45.53 | 45.53 | -0.02% | 157.18 |
| Belgium | 39.06 | 24.15 | 61.74% | 109.13 |
| France | 37.93 | 23.97 | 58.26% | 102.84 |
| Italy | 37.57 | 23.25 | 61.59% | 90.96 |
| Hong Kong | 26.31 | 16.54 | 59.03% | 65.90 |
| Thailand | 25.70 | 16.89 | 52.17% | 80.62 |
| India | 20.47 | 16.10 | 27.16% | 59.34 |
| Mexico | 19.01 | 13.59 | 39.87% | 55.06 |
| Taiwan | 17.16 | 13.21 | 29.82% | 52.18 |
| Bangladesh | 16.00 | 15.94 | 0.35% | 51.67 |
| Russia | 15.06 | 17.20 | -12.43% | 55.52 |
| Poland | 14.63 | 12.17 | 20.25% | 41.83 |
| Malaysia | 13.13 | 11.93 | 10.08% | 42.56 |
| Sweden | 9.36 | 8.74 | 7.18% | 28.75 |
| Philippines | 8.67 | 5.23 | 65.83% | 22.07 |
| Chile | 7.84 | 4.69 | 67.10% | 20.12 |
| Singapore | 7.11 | 4.17 | 70.34% | 18.90 |
| Brazil | 6.28 | 6.25 | 0.46% | 20.45 |
| Tanzania | 5.18 | 0.07 | 7178.96% | 5.32 |
| Denmark | 4.90 | 2.86 | 71.23% | 11.82 |
| New Zealand | 4.83 | 6.10 | -20.75% | 17.11 |
| Panama | 0.00 | 0.00 | -13.40% | 13.96 |
| Sri Lanka | 4.10 | 2.30 | 78.14% | 9.96 |
| Turkey | 3.91 | 2.23 | 74.79% | 8.50 |
| Colombia | 0.00 | 0.00 | 115.56% | 8.59 |
| UAE | 3.42 | 10.16 | -66.32% | 33.65 |
| Mozambique | 0.00 | 0.00 | 0.00% | 8.98 |
| Argentina | 2.89 | 2.50 | 15.56% | 5.35 |
| Saudi Arabia | 2.63 | 0.00 | 0.00% | 10.72 |
| South Africa | 2.55 | 2.43 | 4.93% | 8.75 |
| Myanmar | 2.52 | 1.42 | 78.05% | 6.67 |
| Czech Republic | 1.96 | 0.76 | 158.52% | 3.75 |
| Peru | 1.91 | 0.62 | 206.93% | 3.78 |
| Israel | 1.34 | 3.27 | -59.02% | 7.16 |
| Kenya | 1.06 | 1.66 | -36.03% | 6.00 |
| Luxembourg | 1.02 | 0.61 | 67.49% | 2.10 |
| Norway | 0.94 | 0.44 | 112.66% | 2.36 |
| Finland | 0.93 | 0.28 | 233.37% | 1.61 |
| Switzerland | 0.88 | 1.63 | -45.98% | 3.64 |
| Laos | 0.79 | 0.41 | 93.89% | 1.94 |
| Austria | 0.73 | 4.54 | -83.98% | 2.19 |
| Greece | 0.40 | 0.13 | 198.76% | 0.84 |
| Slovakia | 0.36 | 0.22 | 65.14% | 0.72 |
| Nigeria | 0.28 | 0.30 | -6.02% | 3.44 |
| Ukraine | 0.00 | 0.00 | 119.34% | 0.64 |
| Angola | 0.00 | 0.00 | -3.82% | 3.18 |
| Ghana | 0.09 | 1.36 | -93.47% | 3.02 |
| Hungary | 0.03 | 0.00 | 0.00% | 0.04 |