
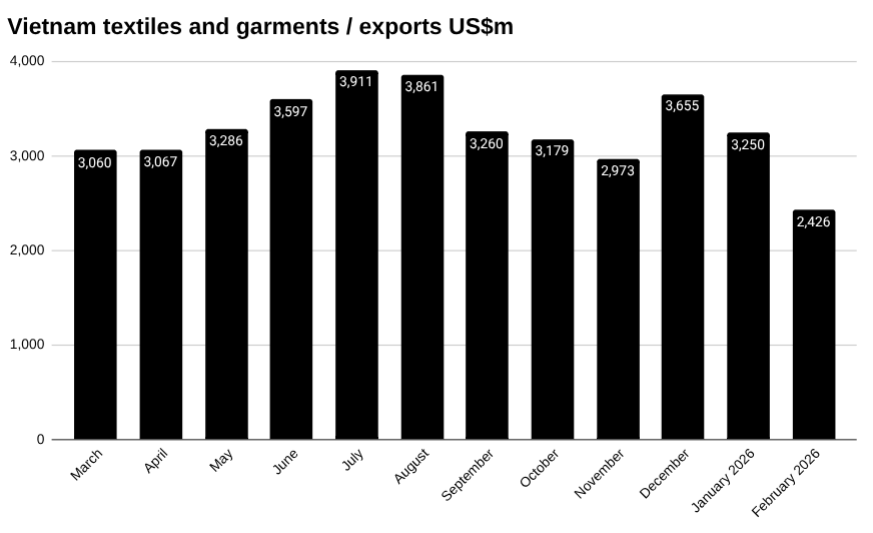
Vietnam exported US$2,426 million worth of textiles and garments in February, down from US$3,250 million in January, a decline of 25.36 percent, according to preliminary data from Vietnam’s General Department of Customs.
Year to date, textiles and garments exports reached US$5,700 million by the end of February.
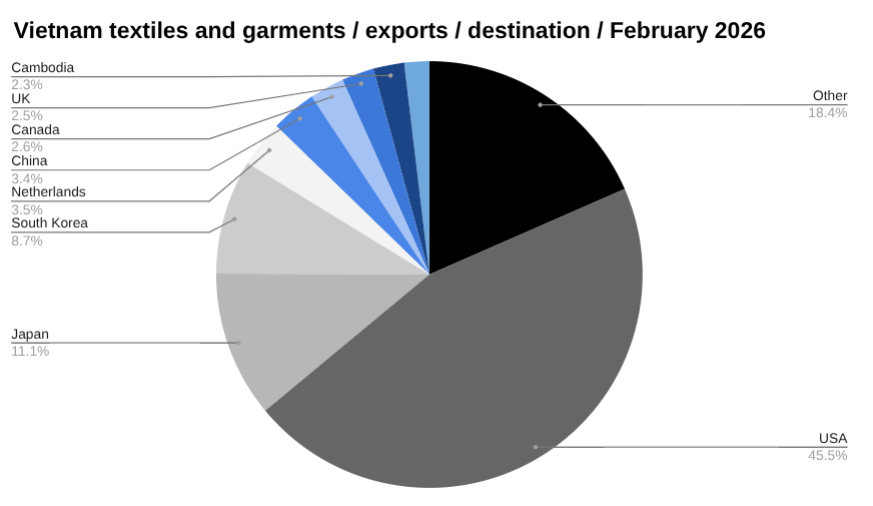
The United States remained Vietnam’s largest market, accounting for US$1,105 million in February exports, down from US$1,418 million in January, a decline of 22.05 percent. Year to date, shipments to the United States totalled US$2,523 million.
Japan was the second largest market, importing US$269 million worth of Vietnamese textiles and garments in February, down from US$348 million in January, a decline of 22.68 percent. Year to date, exports to Japan reached US$617 million.
South Korea followed with imports valued at US$210 million in February, down from US$265 million in January, a decline of 20.60 percent. Year to date, Vietnam exported US$475 million worth of textiles and garments to South Korea.
ANALYSIS: Has Vietnam Reached Peak Garment & Textile Manufacturing?
Vietnam’s garment and textile exports fell short of expectations in 2025. Is this a sign that Vietnam’s garment and textile industry may have peaked?
The Netherlands imported US$85 million worth of Vietnamese textiles and garments in February, down from US$102 million in January, a decline of 16.48 percent. Year to date, exports to the Netherlands totalled US$187 million.
China rounded out the top five markets, importing US$83 million in February, down from US$139 million in January, a decline of 39.96 percent. Year to date, exports to China reached US$223 million.
Learn more about manufacturing in Vietnam→
Vietnam textiles and garments news
Recent developments in textiles and garments in Vietnam include:
Textile / footwear materials imports
Vietnam imported textile and footwear materials to the tune of US$640 million in January, down from US$683 million in December, a change of -6.34 percent, according to preliminary data from Vietnam’s General Department of Customs.
Textile / garment industry performance 2025
Vietnam’s textile and garment industry saw listed firms’ revenue rising 7 percent and net profit up 48 percent, while exports reached about US$46 billion in 2025, Vietstock reported in early February.
Much of the growth was front-loaded into early 2025 as buyers accelerated orders, with a visible slowdown in the fourth quarter and pressure on prices and margins, the publication said.
See the latest Vietnam news headlines→
Listed textiles and garments companies
Key textiles and garments firms listed on the Vietnam stock exchange include:
Binh Thanh Import Export Production and Trade JSC (GIL)
In February, GIL shares moved from 13.60 to 15.00, a change of 1.40 (0.10 percent). Foreign ownership was unchanged.
Song Hong Garment JSC (MSH)
In February, MSH shares moved from 35.90 to 39.25, a change of 3.35 (0.09 percent). Foreign ownership was unchanged.
Thanh Cong Textile Garment Investment Trading JSC (TCM)
In February, TCM shares moved from 26.70 to 26.70, a change of 0.00 (0.00 percent). Foreign ownership was unchanged.
Explore opening a trading account in Vietnam→
Vietnam’s textiles and garments industry
Vietnam’s textiles and garments industry is one of the country’s largest export sectors, supplying global brands and retailers across North America, Europe and Asia.
The industry has developed rapidly since the 1990s, supported by trade agreements, competitive labour costs and large inflows of foreign direct investment.
Major production hubs are concentrated in provinces around Ho Chi Minh City, Hanoi and the Red River Delta, where factories specialise in garments, fabrics and textile inputs.
Vietnam is among the world’s leading apparel exporters, with the sector playing a central role in employment, manufacturing output and export earnings.
Find out about starting a business in Vietnam→
The data
Vietnam’s exports of textiles and garments in February, US$m
| February | January | MoM | YTD | |
| Total | 2,425.96 | 3,250.43 | -25.36% | 5,699.70 |
| Other | 33.72 | 41.61 | -18.97% | 98.63 |
| USA | 1,104.97 | 1,417.56 | -22.05% | 2,522.53 |
| Japan | 268.99 | 347.89 | -22.68% | 616.88 |
| South Korea | 210.32 | 264.88 | -20.60% | 475.21 |
| Netherlands | 85.17 | 101.97 | -16.48% | 187.14 |
| China | 83.48 | 139.05 | -39.96% | 222.53 |
| Canada | 63.42 | 83.53 | -24.07% | 146.95 |
| UK | 59.46 | 76.43 | -22.20% | 135.89 |
| Cambodia | 56.92 | 88.73 | -35.85% | 145.64 |
| Australia | 45.92 | 62.16 | -26.11% | 108.08 |
| Spain | 45.53 | 66.12 | -31.13% | 111.66 |
| Indonesia | 39.55 | 49.23 | -19.66% | 88.79 |
| Germany | 39.29 | 63.60 | -38.22% | 102.90 |
| Belgium | 24.15 | 45.92 | -47.40% | 70.07 |
| France | 23.97 | 40.93 | -41.44% | 64.90 |
| Italy | 23.25 | 30.14 | -22.85% | 53.39 |
| Russia | 17.20 | 23.26 | -26.03% | 40.46 |
| Thailand | 16.89 | 38.02 | -55.58% | 54.91 |
| Hong Kong | 16.54 | 23.04 | -28.19% | 39.58 |
| India | 16.10 | 22.77 | -29.29% | 38.87 |
| Bangladesh | 15.94 | 19.72 | -19.15% | 35.67 |
| Mexico | 13.59 | 22.45 | -39.45% | 36.04 |
| Taiwan | 13.21 | 21.81 | -39.40% | 35.02 |
| Poland | 12.17 | 15.03 | -19.05% | 27.20 |
| Malaysia | 11.93 | 17.51 | -31.88% | 29.43 |
| UAE | 10.16 | 20.07 | -49.40% | 30.23 |
| Sweden | 8.74 | 10.65 | -17.96% | 19.39 |
| Brazil | 6.25 | 7.91 | -20.94% | 14.17 |
| New Zealand | 6.10 | 6.18 | -1.28% | 12.28 |
| Philippines | 5.23 | 8.18 | -36.07% | 13.40 |
| Panama | 4.78 | 5.05 | -5.38% | 9.82 |
| Chile | 4.69 | 7.58 | -38.04% | 12.27 |
| Austria | 4.54 | 0.96 | 371.31% | 8.10 |
| Singapore | 4.17 | 7.62 | -45.23% | 11.79 |
| Israel | 3.27 | 2.55 | 27.86% | 5.82 |
| Denmark | 2.86 | 4.07 | -29.72% | 6.93 |
| Argentina | 2.50 | 2.61 | -4.00% | 5.11 |
| South Africa | 2.43 | 3.77 | -35.50% | 6.20 |
| Sri Lanka | 2.30 | 3.55 | -35.22% | 5.86 |
| Turkey | 2.23 | 2.36 | -5.31% | 4.59 |
| Colombia | 1.73 | 3.11 | -44.34% | 4.85 |
| Kenya | 1.66 | 3.29 | -49.56% | 4.95 |
| Switzerland | 1.63 | 1.13 | 43.65% | 2.76 |
| Myanmar | 1.42 | 2.73 | -48.08% | 4.15 |
| Ghana | 1.36 | 1.57 | -13.27% | 2.93 |
| Egypt | 1.21 | 1.24 | -2.63% | 2.45 |
| Czech Republic | 0.76 | 1.04 | -26.86% | 1.79 |
| Peru | 0.62 | 1.25 | -50.49% | 1.88 |
| Luxembourg | 0.61 | 0.47 | 28.34% | 1.08 |
| Austria | 0.50 | 0.00 | 0.00% | 1.47 |
| Norway | 0.44 | 0.97 | -54.09% | 1.41 |
| Laos | 0.41 | 0.75 | -45.60% | 1.15 |
| Ivory Coast | 0.32 | 0.00 | 0.00% | 0.32 |
| Nigeria | 0.30 | 2.86 | -89.41% | 3.16 |
| Finland | 0.28 | 0.40 | -29.62% | 0.68 |
| Slovakia | 0.22 | 0.14 | 52.23% | 0.36 |
| Angola | 0.20 | 2.79 | -92.73% | 2.99 |
| Greece | 0.13 | 0.31 | -56.38% | 0.44 |
| Ukraine | 0.12 | 0.25 | -52.66% | 0.37 |
| Tanzania | 0.07 | 0.06 | 11.86% | 0.13 |
| Hungary | 0.00 | 0.00 | 0.00% | 0.00 |
| Mozambique | 0.00 | 6.05 | -100.00% | 6.05 |
| Saudi Arabia | 0.00 | 3.56 | -100.00% | 0.00 |
| Senegal | 0.00 | 0.00 | 0.00% | 0.00 |