
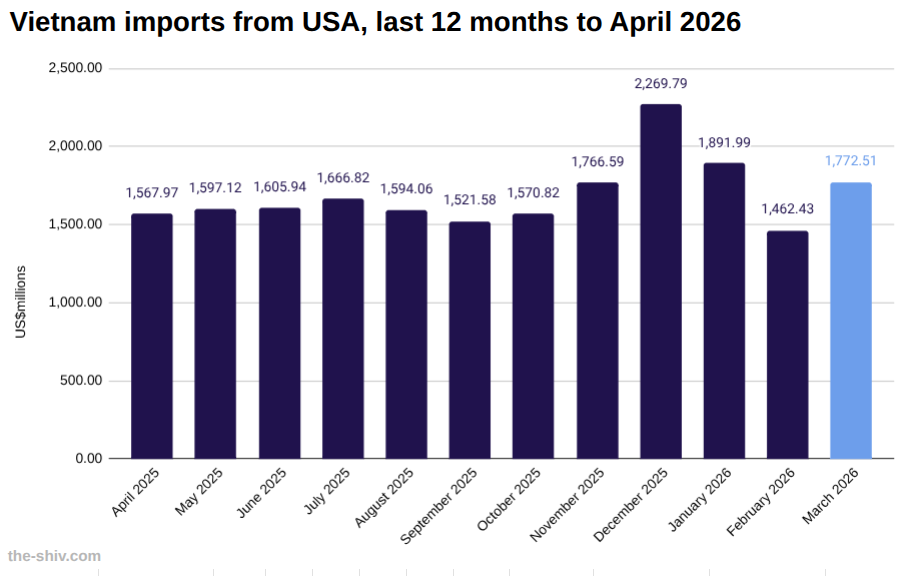
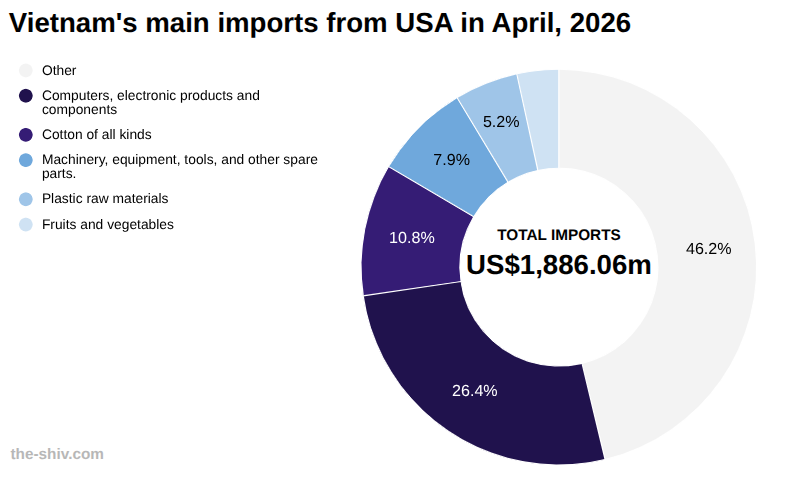
In April, Vietnam imported US$1,886.06 million worth of goods from the USA, up from US$1,772.51 million in March, a change of 6.41 percent, according to preliminary data from Vietnam’s General Department of Customs.
So far this year, Vietnam has imported US$7,029 million worth of goods from the USA.
Vietnam-USA trade relations
Vietnam–United States trade relations have expanded rapidly, making the US Vietnam’s largest export market and a key driver of bilateral economic ties.
Trade is heavily weighted toward Vietnamese exports, particularly electronics, textiles, footwear, and furniture, reflecting Vietnam’s role in global manufacturing supply chains.
The relationship has deepened through investment flows, supply chain diversification, and growing cooperation in technology, energy, and services.
Ongoing challenges include trade imbalances, regulatory differences, and evolving US trade policy, though both sides continue to pursue closer economic alignment.
Explore starting a business in Vietnam→
The data
Vietnam imports from the USA in April US$m
| April | March | MoM | YTD | |
| Total | 1,886.06 | 1,772.51 | 6.41% | 7,029.34 |
| Other | 431.42 | 318.40 | 35.49% | 1,386.63 |
| Computers, electronic products and components | 498.65 | 478.45 | 4.22% | 1,824.82 |
| Machinery, equipment, tools, and other spare parts. | 203.92 | 140.10 | 45.56% | 511.65 |
| Machinery, equipment, tools, and other spare parts. | 149.05 | 145.17 | 2.67% | 500.85 |
| Plastic raw materials | 97.91 | 114.80 | -14.71% | 410.54 |
| Fruits and vegetables | 64.28 | 46.65 | 37.81% | 277.77 |
| Wood and wood products | 62.77 | 75.91 | -17.31% | 244.51 |
| Chemicals | 54.07 | 68.81 | -21.43% | 234.14 |
| Animal feed and raw materials | 51.32 | 72.43 | -29.14% | 290.94 |
| Chemical products | 37.40 | 37.80 | -1.07% | 136.88 |
| Raw materials for textiles, garments, leather, and footwear. | 27.13 | 39.57 | -31.43% | 129.67 |
| Other food products | 26.22 | 0.00 | 0.00% | 88.23 |
| Soybeans | 24.35 | 62.27 | -60.90% | 282.43 |
| Pharmaceuticals | 21.13 | 30.97 | -31.77% | 87.82 |
| Plastic products | 16.36 | 21.02 | -22.16% | 68.06 |
| Seafood | 16.31 | 5.53 | 195.17% | 35.36 |
| Scrap iron and steel | 13.98 | 13.47 | 3.78% | 50.95 |
| Milk and dairy products | 13.27 | 16.50 | -19.60% | 51.55 |
| Iron and steel products | 12.29 | 10.05 | 22.24% | 37.12 |
| Fragrances, cosmetics and hygiene products | 9.05 | 15.35 | -41.01% | 40.06 |
| Ore and other minerals | 8.54 | 6.53 | 30.68% | 22.57 |
| Complete automobiles of all types | 8.35 | 1.00 | 733.16% | 11.11 |
| Gemstones, precious metals and products | 7.28 | 9.70 | -24.94% | 138.67 |
| Electrical wires and cables | 4.32 | 7.24 | -40.32% | 18.80 |
| Automotive components and parts | 4.29 | 2.46 | 74.64% | 17.36 |
| Rubber | 3.52 | 4.44 | -20.79% | 13.75 |
| Rubber products | 3.19 | 3.96 | -19.42% | 12.59 |
| Fabrics of all kinds | 2.42 | 4.21 | -42.63% | 15.93 |
| Wheat | 2.27 | 2.53 | -10.05% | 31.79 |
| Paper products | 2.06 | 1.44 | 43.26% | 5.85 |
| Confectionery and cereal products | 1.77 | 5.74 | -69.13% | 16.37 |
| Paper of all kinds | 1.76 | 2.25 | -22.10% | 6.22 |
| Other petroleum products | 1.15 | 1.78 | -35.28% | 6.98 |
| Cameras, camcorders, and accessories | 0.97 | 0.93 | 4.34% | 4.38 |
| Glass and glass products | 0.77 | 0.91 | -15.59% | 3.72 |
| Pesticides and raw materials | 0.72 | 1.71 | -57.74% | 4.75 |
| Fertilizers of all kinds | 0.66 | 0.51 | 29.28% | 2.20 |
| Iron and steel of all kinds | 0.54 | 1.21 | -55.69% | 4.02 |
| Animal and vegetable oils and fats | 0.29 | 0.39 | -26.23% | 1.10 |
| Tobacco raw materials | 0.20 | 0.31 | -34.45% | 0.99 |
| Phones of all types and components | 0.10 | 0.00 | 0.00% | 0.22 |
Vietnam trade with the USA year to date US$m
| April | March | MoM | YTD | |
| Imports | 1,886.06 | 1,772.51 | 6.41% | 7,029.34 |
| Exports | 15,075.22 | 15,190.98 | -0.76% | 54,037.62 |
| Total | 16,961.28 | 16,963.49 | -0.01% | 61,066.97 |
| Balance | 13,189.16 | 13,418.48 | -1.71% | 47,008.28 |