
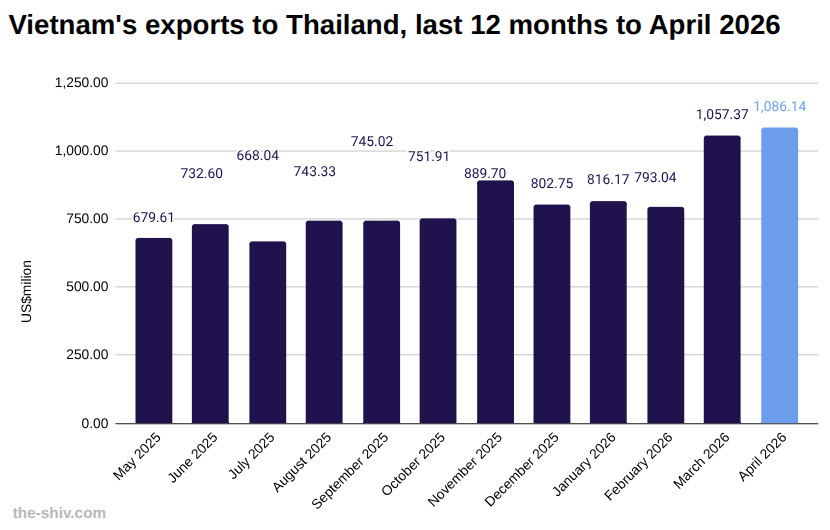
In April, Vietnam exported US$1,086 million worth of goods to Thailand, up 2.72 percent over March, according to preliminary data from Vietnam’s General Department of Customs.
So far this year, Vietnam has exported US$3,759 million worth of goods to Thailand.
The data
Vietnam trade with Thailand year to date April 2026 US$m
| April | March | Change | YTD | |
| Imports | 1,172.77 | 1,479.35 | -20.72% | 4,835.97 |
| Exports | 1,086.14 | 1,057.37 | 2.72% | 3,759.16 |
| Total | 2,258.91 | 2,536.71 | -10.95% | 8,595.14 |
| Balance | -86.62 | -421.98 | -79.47% | -1,076.81 |
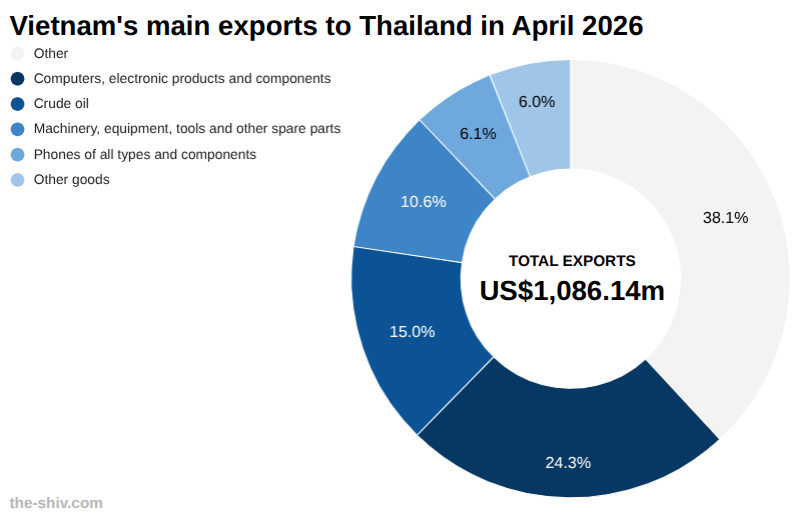
Vietnam exports to Thailand in April 2026 US$m
| April | March | Change | YTD | |
| Total | 1,086.14 | 1,057.37 | 2.72% | 3,759.16 |
| Computers, electronic products and components | 263.47 | 354.17 | -25.61% | 1,029.21 |
| Crude oil | 162.95 | 0.00 | 0.00% | 203.24 |
| Machinery, equipment, tools and other spare parts | 114.74 | 112.04 | 2.41% | 433.65 |
| Phones of all types and components | 66.06 | 141.71 | -53.38% | 398.04 |
| Other goods | 65.28 | 77.43 | -15.68% | 264.38 |
| Transportation vehicles and spare parts | 61.39 | 67.73 | -9.35% | 234.04 |
| Chemicals | 41.82 | 11.60 | 260.63% | 66.01 |
| Plastic raw materials | 34.68 | 31.76 | 9.19% | 79.39 |
| Gasoline and diesel fuel of all kinds | 29.44 | 0.14 | 20787.02% | 66.52 |
| Coffee | 24.62 | 32.05 | -23.19% | 105.24 |
| Iron and steel products | 22.50 | 16.74 | 34.46% | 75.21 |
| Seafood | 22.17 | 30.04 | -26.18% | 108.75 |
| Iron and steel of all kinds | 21.05 | 16.45 | 27.95% | 88.03 |
| Paper and paper products | 15.85 | 20.71 | -23.47% | 63.00 |
| Textiles and garments | 15.78 | 25.70 | -38.61% | 96.27 |
| Chemical products | 15.37 | 12.19 | 26.14% | 48.20 |
| Plastic products | 12.42 | 11.50 | 8.01% | 40.89 |
| Electrical wires and cables | 10.08 | 9.61 | 4.90% | 36.13 |
| Fruits and vegetables | 9.95 | 11.08 | -10.27% | 43.51 |
| Footwear of all kinds | 9.09 | 8.37 | 8.60% | 36.61 |
| Pepper | 8.14 | 8.53 | -4.54% | 30.69 |
| Cashew | 7.09 | 7.13 | -0.48% | 27.13 |
| Animal feed and raw materials | 6.33 | 7.63 | -16.93% | 21.37 |
| Wood and wood products | 6.09 | 5.66 | 7.53% | 28.49 |
| Fibers and yarns of all kinds | 6.08 | 4.97 | 22.24% | 20.86 |
| Raw materials for textiles, garments, leather, and footwear. | 5.78 | 5.38 | 7.52% | 20.04 |
| Other common metals | 5.42 | 3.40 | 59.71% | 13.29 |
| Curtain fabrics, other technical fabrics | 0.00 | 0.00 | 8.93% | 16.00 |
| Fertilizers of all kinds | 4.11 | 7.33 | -43.91% | 13.07 |
| Ceramic products | 3.32 | 2.43 | 36.67% | 11.63 |
| Gemstones, precious metals and products | 2.84 | 2.73 | 4.09% | 10.30 |
| Confectionery and cereal products | 2.29 | 2.80 | -18.33% | 9.67 |
| Rubber products | 2.26 | 2.16 | 4.87% | 8.19 |
| Coal of all kinds | 1.65 | 0.69 | 140.82% | 5.43 |
| Handbags, wallets, suitcases, hats, umbrellas. | 1.12 | 1.10 | 2.11% | 4.38 |
| Glass and glass products | 0.63 | 0.53 | 17.61% | 2.22 |
| Ore and other minerals | 0.00 | 0.00 | 0.00% | 0.08 |