
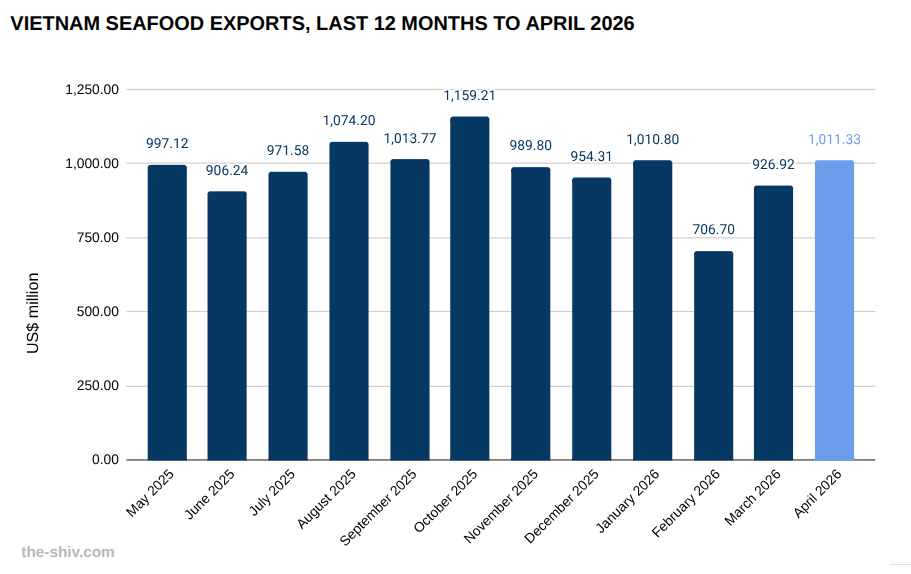
Vietnam exported seafood to the tune of US$1,011 million in April, up from US$927 million in March, a change of 9.11 percent, according to preliminary data from Vietnam’s General Department of Customs.
Year to date, Vietnam had exported US$3,651 million worth of seafood by the end of April.

Vietnam’s seafood industry
Vietnam’s seafood industry is a key export-oriented sector, supported by abundant marine resources and established aquaculture production.
The country specialises in products such as shrimp, pangasius, and tuna, with processing facilities geared towards international standards and markets.
Production is influenced by global demand, input costs, and regulatory requirements in major export destinations.
Ongoing investment in technology and value-added processing is helping the industry move up the value chain and strengthen competitiveness.
Find out about starting a business in Vietnam→
The data
Vietnam exports of seafood in April, 2026 US$m
| April | March | MoM | YTD | |
| Total | 1,011.33 | 926.92 | 9.11% | 3,650.72 |
| Other | 28.01 | 24.55 | 14.08% | 91.50 |
| China | 244.45 | 217.29 | 12.50% | 950.74 |
| USA | 172.69 | 133.96 | 28.91% | 515.52 |
| Japan | 134.35 | 132.22 | 1.61% | 499.72 |
| South Korea | 70.56 | 68.36 | 3.21% | 253.21 |
| Australia | 30.06 | 33.18 | -9.41% | 114.58 |
| UK | 29.16 | 23.77 | 22.66% | 97.05 |
| Brazil | 23.54 | 19.18 | 22.72% | 83.96 |
| Canada | 23.25 | 27.68 | -15.99% | 85.98 |
| Thailand | 22.17 | 30.04 | -26.18% | 108.75 |
| Taiwan | 21.23 | 16.49 | 28.71% | 67.39 |
| Russia | 20.69 | 20.16 | 2.63% | 68.92 |
| Netherlands | 18.93 | 19.93 | -5.04% | 67.61 |
| Germany | 15.88 | 14.77 | 7.50% | 64.49 |
| Malaysia | 14.93 | 11.74 | 27.08% | 47.00 |
| Belgium | 12.71 | 12.15 | 4.54% | 46.01 |
| Hong Kong | 11.45 | 13.55 | -15.52% | 48.71 |
| Philippines | 11.02 | 10.82 | 1.89% | 41.35 |
| Mexico | 10.85 | 8.06 | 34.54% | 40.49 |
| Singapore | 8.27 | 10.04 | -17.58% | 34.48 |
| Saudi Arabia | 7.55 | 6.21 | 21.61% | 23.97 |
| Egypt | 7.20 | 0.00 | 0.00% | 20.57 |
| Italy | 6.76 | 5.54 | 22.06% | 23.08 |
| Spain | 6.72 | 8.38 | -19.84% | 28.72 |
| Israel | 6.07 | 6.09 | -0.42% | 22.44 |
| Lithuania | 5.46 | 2.40 | 127.96% | 14.80 |
| Colombia | 0.00 | 0.00 | -16.82% | 23.27 |
| Switzerland | 3.99 | 3.36 | 18.62% | 9.53 |
| Portugal | 3.86 | 3.81 | 1.45% | 15.48 |
| France | 3.68 | 5.12 | -28.11% | 17.19 |
| Sweden | 3.28 | 2.59 | 26.61% | 10.22 |
| Poland | 3.01 | 4.54 | -33.81% | 14.43 |
| Indonesia | 2.66 | 1.26 | 111.82% | 4.94 |
| Romania | 2.41 | 1.76 | 37.06% | 7.57 |
| New Zealand | 2.32 | 3.04 | -23.69% | 9.86 |
| Denmark | 2.26 | 4.60 | -50.81% | 13.81 |
| Peru | 2.13 | 1.79 | 18.89% | 6.66 |
| India | 1.97 | 1.39 | 41.90% | 6.73 |
| Ukraine | 0.00 | 0.00 | 10.26% | 5.40 |
| Chile | 1.53 | 1.72 | -11.02% | 7.00 |
| Cambodia | 1.40 | 1.93 | -27.21% | 7.65 |
| UAE | 1.22 | 0.26 | 368.11% | 9.78 |
| Norway | 1.03 | 2.32 | -55.64% | 5.38 |
| Greece | 0.94 | 1.36 | -30.73% | 3.98 |
| Turkey | 0.61 | 0.91 | -33.43% | 2.06 |
| Algeria | 0.00 | 0.00 | 0.00% | 0.87 |
| Panama | 0.00 | 0.00 | 533.56% | 1.07 |
| Brunei Darussalam | 0.37 | 0.22 | 68.70% | 0.76 |
| Senegal | 0.23 | 0.07 | 241.63% | 0.29 |
| Cyprus | 0.22 | 0.00 | 0.00% | 2.17 |
| Pakistan | 0.18 | 0.00 | 0.00% | 2.07 |
| Belarus | 0.11 | 0.00 | 0.00% | 0.18 |
| Sri Lanka | 0.10 | 0.09 | 15.82% | 0.31 |
| Czech Republic | 0.09 | 0.44 | -80.36% | 0.73 |
| Angola | 0.00 | 0.00 | 0.00% | 0.28 |