
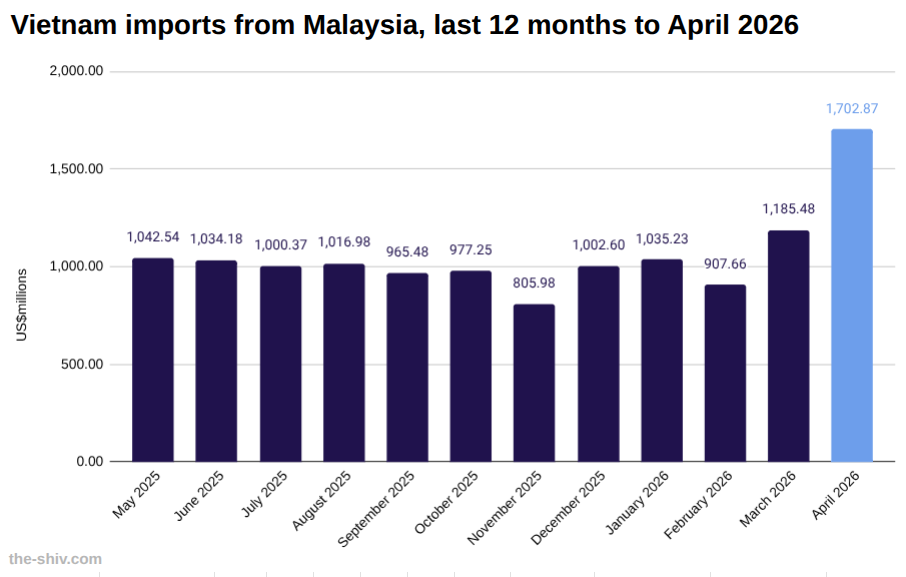
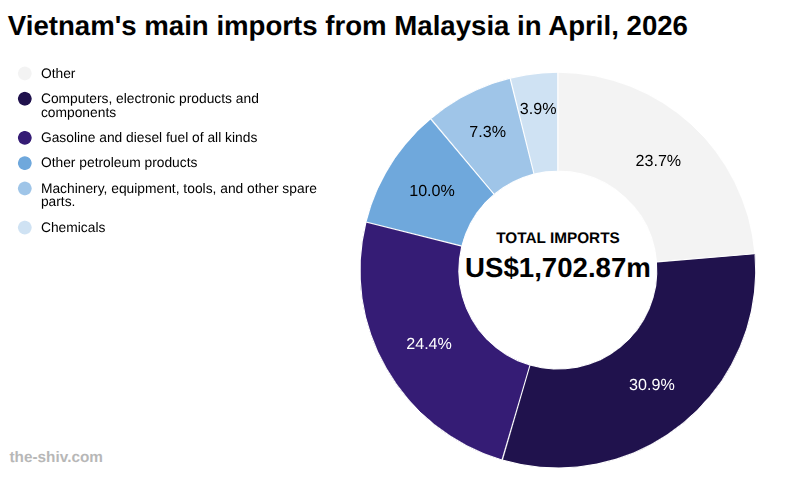
In April, Vietnam imported US$1,702.87 million worth of goods from Malaysia, up from US$1,185.48 million in March, a change of 43.64 percent, according to preliminary data from Vietnam’s General Department of Customs.
So far this year, Vietnam has imported US$4,862 million worth of goods from Malaysia.
Vietnam-Malaysia trade relations
Vietnam and Malaysia maintain strong trade relations, supported by regional integration and shared participation in ASEAN frameworks.
Bilateral trade is driven by Vietnam’s exports of electronics, machinery, and agricultural products, alongside imports of petroleum, chemicals, and industrial inputs from Malaysia.
Supply chain linkages between the two economies continue to deepen, particularly in manufacturing and energy-related sectors.
Ongoing cooperation and trade facilitation measures are expected to support further growth in bilateral trade in the coming years.
Explore starting a business in Vietnam→
The data
Vietnam imports from Malaysia in April US$m
| April | March | MoM | YTD | |
| Total | 1,702.87 | 1,185.48 | 43.64% | 4,862.34 |
| Other | 104.56 | 122.26 | -14.48% | 371.23 |
| Computers, electronic products and components | 525.60 | 377.57 | 39.20% | 1,487.12 |
| Machinery, equipment, tools, and other spare parts. | 414.93 | 190.57 | 117.74% | 952.71 |
| Other petroleum products | 169.63 | 5.72 | 2863.85% | 183.49 |
| Machinery, equipment, tools, and other spare parts. | 123.50 | 129.28 | -4.47% | 511.93 |
| Chemicals | 66.03 | 62.48 | 5.68% | 234.23 |
| Animal and vegetable oils and fats | 62.73 | 50.27 | 24.77% | 202.12 |
| Household electrical appliances and components | 40.85 | 58.89 | -30.64% | 180.67 |
| Liquefied petroleum gas | 37.64 | 24.62 | 52.88% | 90.87 |
| Plastic raw materials | 27.31 | 35.72 | -23.54% | 111.55 |
| Chemical products | 24.74 | 22.05 | 12.16% | 84.56 |
| Paper of all kinds | 15.43 | 20.96 | -26.39% | 66.68 |
| Fabrics of all kinds | 12.59 | 13.67 | -7.90% | 45.52 |
| Other food products | 7.89 | 0.00 | 0.00% | 30.81 |
| Plastic products | 7.70 | 6.99 | 10.23% | 31.61 |
| Iron and steel products | 7.26 | 6.51 | 11.41% | 22.78 |
| Confectionery and cereal products | 5.56 | 6.10 | -8.84% | 21.65 |
| Milk and dairy products | 5.55 | 4.78 | 16.03% | 17.60 |
| Glass and glass products | 4.85 | 3.38 | 43.38% | 17.88 |
| Fibers and yarns of all kinds | 4.43 | 2.58 | 71.68% | 13.39 |
| Animal feed and raw materials | 4.37 | 3.67 | 19.06% | 15.20 |
| Rubber products | 4.27 | 4.68 | -8.88% | 16.98 |
| Electrical wires and cables | 3.44 | 9.87 | -65.12% | 30.21 |
| Raw materials for textiles, garments, leather, and footwear. | 2.82 | 2.40 | 17.93% | 9.34 |
| Wood and wood products | 2.62 | 2.18 | 20.29% | 7.92 |
| Automotive components and parts | 2.61 | 1.72 | 51.82% | 8.50 |
| Pesticides and raw materials | 2.44 | 2.08 | 17.00% | 8.79 |
| Iron and steel of all kinds | 2.34 | 0.95 | 146.70% | 35.04 |
| Pharmaceuticals | 1.89 | 1.09 | 73.14% | 8.55 |
| Rubber | 1.53 | 1.51 | 1.12% | 5.77 |
| Paper products | 1.49 | 0.92 | 62.39% | 4.33 |
| Seafood | 1.44 | 1.94 | -25.49% | 7.98 |
| Fragrances, cosmetics and hygiene products | 1.39 | 2.06 | -32.57% | 5.23 |
| Ore and other minerals | 0.51 | 4.86 | -89.57% | 16.48 |
| Tobacco raw materials | 0.48 | 0.40 | 20.93% | 1.31 |
| Fruits and vegetables | 0.33 | 0.47 | -30.24% | 1.43 |
| Fertilisers of all kinds | 0.13 | 0.24 | -46.90% | 0.76 |
| Coal of all kinds | 0.02 | 0.05 | -60.00% | 0.12 |
Vietnam trade with Malaysia year to date US$m
| April | March | MoM | YTD | |
| Imports | 1,702.87 | 1,185.48 | 43.64% | 4,862.34 |
| Exports | 620.52 | 559.64 | 10.88% | 2,139.07 |
| Total | 2,323.39 | 1,745.12 | 33.14% | 7,001.41 |
| Balance | -1,082.35 | -625.84 | 72.94% | -2,723.27 |