
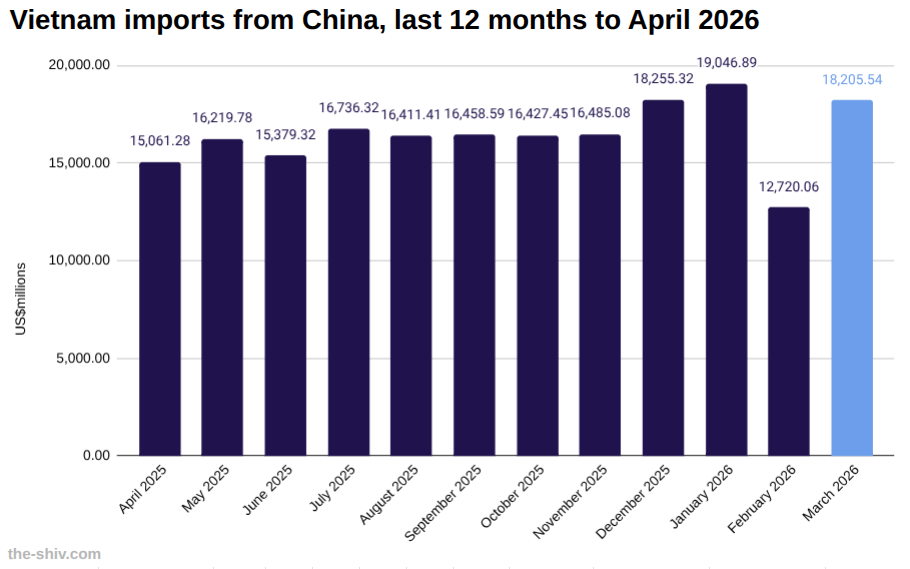
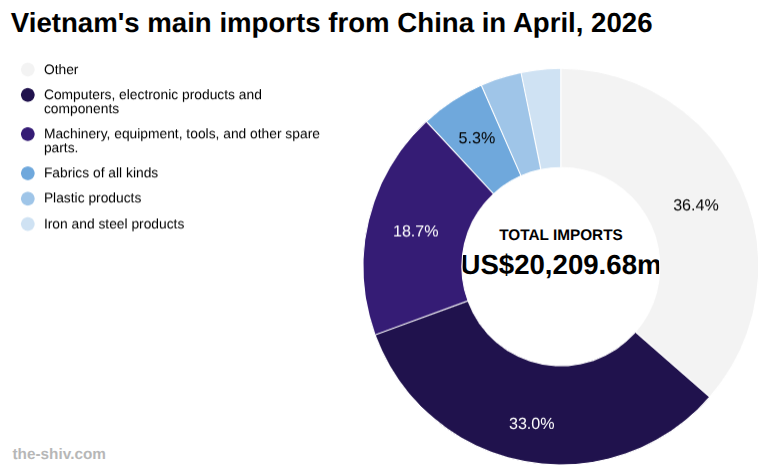
In April, Vietnam imported US$20,209.68 million worth of goods from China, up from US$18,205.54 million in March, a change of 11.01 percent, according to preliminary data from Vietnam’s General Department of Customs.
So far this year, Vietnam has imported US$70,262 million worth of goods from China.
Vietnam-China trade relations
China is Vietnam’s largest trading partner, supplying key inputs such as machinery, electronics, and raw materials for its export-oriented manufacturing sector.
Bilateral trade continues to expand, driven by supply chain integration, cross-border production networks, and strong demand for intermediate goods.
Vietnam maintains a significant trade deficit with China, reflecting its reliance on imported inputs to support domestic production and exports.
Policy shifts, infrastructure links, and geopolitical dynamics are expected to shape future trade flows between the two economies.
Explore starting a business in Vietnam→
The data
Vietnam imports from China in April US$m
| April | March | MoM | YTD | |
| Total | 20,209.68 | 18,205.54 | 11.01% | 70,262.06 |
| Other | 1,741.90 | 1,615.19 | 7.85% | 6,179.69 |
| Computers, electronic products and components | 6,663.30 | 6,489.18 | 2.68% | 23,433.20 |
| Machinery, equipment, tools, and other spare parts. | 3,777.26 | 3,359.58 | 12.43% | 13,464.67 |
| Fabrics of all kinds | 1,075.01 | 667.35 | 61.09% | 3,348.45 |
| Plastic products | 678.48 | 580.29 | 16.92% | 2,365.30 |
| Iron and steel products | 652.25 | 522.12 | 24.92% | 2,195.52 |
| Phones of all types and components | 604.68 | 618.65 | -2.26% | 2,540.25 |
| Plastic raw materials | 579.69 | 476.72 | 21.60% | 1,680.05 |
| Chemicals | 518.54 | 398.59 | 30.09% | 1,463.88 |
| Raw materials for textiles, garments, leather, and footwear. | 462.01 | 358.24 | 28.97% | 1,521.67 |
| Iron and steel of all kinds | 454.42 | 367.03 | 23.81% | 1,515.69 |
| Chemical products | 373.65 | 340.98 | 9.58% | 1,269.82 |
| Electrical wires and cables | 303.72 | 267.39 | 13.59% | 1,060.26 |
| Automotive components and parts | 290.92 | 349.75 | -16.82% | 1,229.52 |
| Complete automobiles of all types | 241.31 | 262.11 | -7.94% | 837.92 |
| Fibers and yarns of all kinds | 196.81 | 171.10 | 15.03% | 658.49 |
| Gemstones, precious metals and products | 149.05 | 60.01 | 148.38% | 505.24 |
| Household electrical appliances and components | 133.23 | 112.62 | 18.30% | 486.03 |
| Wood and wood products | 128.44 | 100.00 | 28.44% | 423.51 |
| Cameras, camcorders, and accessories | 122.21 | 112.38 | 8.75% | 473.80 |
| Gasoline and diesel fuel of all kinds | 115.87 | 134.22 | -13.68% | 394.75 |
| Fruits and vegetables | 101.00 | 100.90 | 0.09% | 415.87 |
| Paper of all kinds | 98.98 | 97.02 | 2.02% | 350.53 |
| Glass and glass products | 93.42 | 112.73 | -17.13% | 372.29 |
| Paper products | 83.41 | 78.00 | 6.93% | 301.52 |
| Rubber products | 68.56 | 56.93 | 20.43% | 235.54 |
| Fertilizers of all kinds | 64.20 | 67.92 | -5.48% | 206.58 |
| Rubber | 62.27 | 47.55 | 30.96% | 183.92 |
| Animal feed and raw materials | 60.54 | 42.23 | 43.36% | 165.01 |
| Liquefied petroleum gas | 57.35 | 34.38 | 66.83% | 129.03 |
| Pesticides and raw materials | 55.70 | 49.85 | 11.74% | 160.61 |
| Pharmaceutical raw materials | 45.50 | 29.47 | 54.40% | 120.53 |
| Fragrances, cosmetics and hygiene products | 35.32 | 28.63 | 23.37% | 119.37 |
| Seafood | 29.52 | 26.73 | 10.46% | 108.43 |
| Other petroleum products | 26.27 | 20.61 | 27.43% | 98.77 |
| Other food products | 18.10 | 0.00 | 0.00% | 63.03 |
| Ore and other minerals | 16.21 | 12.34 | 31.29% | 49.35 |
| Confectionery and cereal products | 12.71 | 17.31 | -26.58% | 62.60 |
| Coal of all kinds | 6.90 | 7.29 | -5.27% | 28.25 |
| Pharmaceuticals | 6.73 | 7.90 | -14.78% | 22.69 |
| Animal and vegetable oils and fats | 2.79 | 3.32 | -15.89% | 12.48 |
| Tobacco raw materials | 1.36 | 0.87 | 56.20% | 7.84 |
| Cotton of all kinds | 0.08 | 0.05 | 63.34% | 0.13 |
Vietnam trade with China year to date US$m
| April | March | MoM | YTD | |
| Imports | 20,209.68 | 18,205.54 | 11.01% | 70,262.06 |
| Exports | 6,147.35 | 5,819.48 | 5.63% | 23,023.76 |
| Total | 26,357.03 | 24,025.02 | 9.71% | 93,285.81 |
| Balance | -14,062.33 | -12,386.07 | 13.53% | -47,238.30 |