
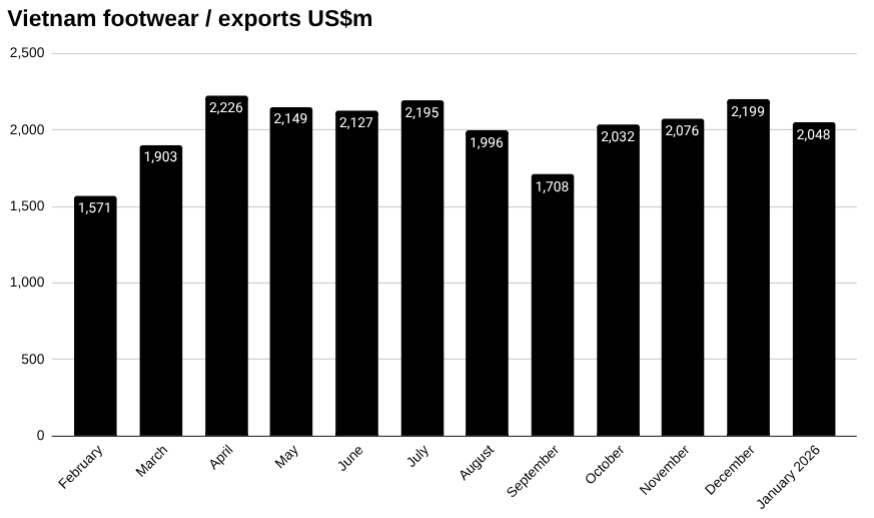
Vietnam exported footwear to the tune of US$2,048 million in January, down from US$2,199 million in December, a change of -6.85 percent, according to preliminary data from Vietnam’s General Department of Customs.
Year to date, Vietnam had exported US$2,048 million worth of footwear by the end of January.
The USA accounted for US$822 million worth of Vietnam’s footwear exports in January. This was down from US$882 million in footwear exports in December, a change of -6.82 percent. Year to date, Vietnam has shipped US$822 million worth of footwear to the USA.
After the USA was the Netherlands, making up US$153 million worth of Vietnam’s footwear exports in January, this was down from US$156 million in footwear exports in December, a change of -1.54 percent. Year to date, Vietnam has shipped US$153 million worth of footwear to the Netherlands.
Next was Japan, taking US$127 million worth of Vietnam’s footwear exports in January. This was up from US$118 million in footwear exports in December, a change of 8.02 percent. Year to date, Vietnam has shipped US$127 million worth of footwear to Japan.
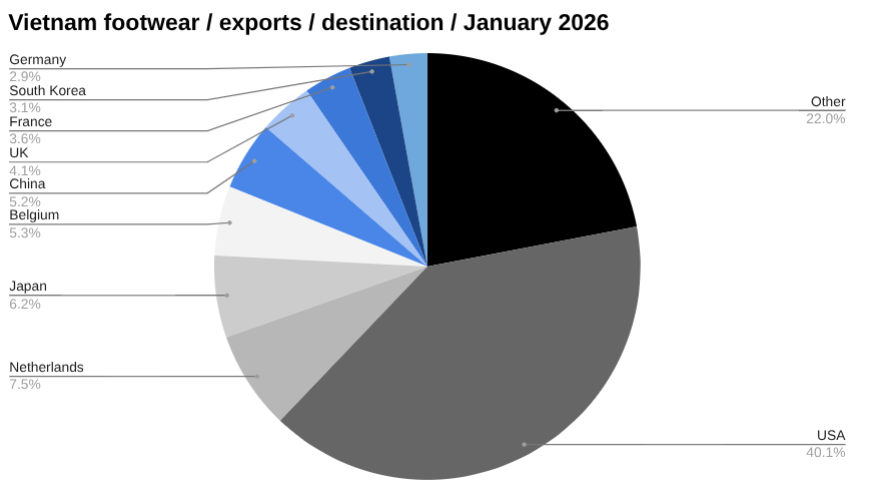
Following Japan was Belgium, representing US$108 million worth of Vietnam’s footwear exports in January. This was up from US$90 million in footwear exports in December, a change of 20.72 percent. Year to date, Vietnam has shipped US$108 million worth of footwear to Belgium.
Rounding out the top five was China, constituting US$107 million worth of Vietnam’s footwear exports in January. This was down from US$130 million in footwear exports in December, a change of -17.63 percent. Year to date, Vietnam has shipped US$107 million worth of footwear to China.
Learn more about manufacturing in Vietnam→
Vietnam’s footwear industry
Vietnam is one of the world’s largest footwear manufacturers and exporters, supplying major global brands and accounting for a significant share of global athletic shoe production.
The industry is heavily export-oriented, with the United States and Europe as key markets, and is deeply integrated into regional supply chains for materials and components.
Global brands including Nike and Adidas source a substantial portion of their footwear from factories in Vietnam, supporting hundreds of thousands of jobs.
While the sector benefits from established manufacturing capacity and trade agreements, it faces ongoing pressures from labour costs, sustainability requirements and shifting global demand.
Find out about starting a business in Vietnam→
The data
Vietnam’s exports of footwear in January, US$m
| January | December | MoM | YTD | |
| Total | 2,047.98 | 2,198.64 | -6.85% | 2,047.98 |
| Other | 28.34 | 21.44 | 32.21% | 28.34 |
| USA | 821.98 | 882.16 | -6.82% | 821.98 |
| Netherlands | 153.27 | 155.68 | -1.54% | 153.27 |
| Japan | 127.01 | 117.58 | 8.02% | 127.01 |
| Belgium | 108.07 | 89.52 | 20.72% | 108.07 |
| China | 106.83 | 129.71 | -17.63% | 106.83 |
| UK | 84.08 | 82.94 | 1.37% | 84.08 |
| France | 74.20 | 60.35 | 22.94% | 74.20 |
| South Korea | 63.41 | 64.50 | -1.69% | 63.41 |
| Germany | 58.54 | 70.76 | -17.28% | 58.54 |
| Spain | 48.15 | 48.04 | 0.24% | 48.15 |
| Mexico | 44.18 | 53.85 | -17.95% | 44.18 |
| Canada | 44.05 | 56.61 | -22.19% | 44.05 |
| Italy | 37.68 | 48.45 | -22.22% | 37.68 |
| Australia | 33.05 | 43.75 | -24.46% | 33.05 |
| Brazil | 17.09 | 20.83 | -17.96% | 17.09 |
| India | 15.76 | 14.16 | 11.31% | 15.76 |
| UAE | 15.10 | 20.93 | -27.84% | 15.10 |
| Poland | 12.19 | 10.90 | 11.91% | 12.19 |
| Thailand | 11.62 | 12.87 | -9.72% | 11.62 |
| Indonesia | 10.98 | 13.90 | -20.99% | 10.98 |
| Taiwan | 10.47 | 14.98 | -30.09% | 10.47 |
| Panama | 10.17 | 14.51 | -29.93% | 10.17 |
| Malaysia | 10.13 | 9.90 | 2.28% | 10.13 |
| Hong Kong | 10.12 | 9.60 | 5.44% | 10.12 |
| Chile | 9.77 | 12.63 | -22.64% | 9.77 |
| Singapore | 9.06 | 11.49 | -21.16% | 9.06 |
| South Africa | 7.60 | 11.78 | -35.49% | 7.60 |
| Philippines | 7.56 | 9.79 | -22.80% | 7.56 |
| Peru | 7.03 | 5.55 | 26.76% | 7.03 |
| Sweden | 6.24 | 9.09 | -31.32% | 6.24 |
| Argentina | 5.50 | 10.15 | -45.79% | 5.50 |
| Turkey | 4.41 | 10.47 | -57.90% | 4.41 |
| Israel | 4.05 | 8.08 | -49.80% | 4.05 |
| Czech Republic | 4.02 | 8.87 | -54.66% | 4.02 |
| Norway | 3.79 | 2.91 | 30.46% | 3.79 |
| New Zealand | 3.59 | 5.00 | -28.18% | 3.59 |
| Austria | 3.51 | 1.43 | 145.11% | 3.51 |
| Denmark | 2.95 | 3.04 | -2.74% | 2.95 |
| Colombia | 2.85 | 3.23 | -11.98% | 2.85 |
| Greece | 2.08 | 2.98 | -30.23% | 2.08 |
| Switzerland | 1.85 | 2.81 | -34.27% | 1.85 |
| Ukraine | 1.29 | 1.46 | -11.94% | 1.29 |
| Romania | 1.26 | 1.27 | -0.39% | 1.26 |
| Russia | 1.10 | 1.81 | -39.05% | 1.10 |
| Slovakia | 0.93 | 0.56 | 64.56% | 0.93 |
| Finland | 0.36 | 0.40 | -8.55% | 0.36 |
| Hungary | 0.30 | 1.37 | -78.07% | 0.30 |
| Kazakhstan | 0.20 | 0.59 | -66.60% | 0.20 |
| Portugal | 0.18 | 0.21 | -13.17% | 0.18 |
| Armenia | 0.00 | 0.00 | 0.00% | 0.00 |
| Cyprus | 0.00 | 0.19 | -100.00% | 0.00 |
| Iceland | 0.00 | 0.00 | 0.00% | 0.00 |
| Luxembourg | 0.00 | 3.56 | -100.00% | 0.00 |