
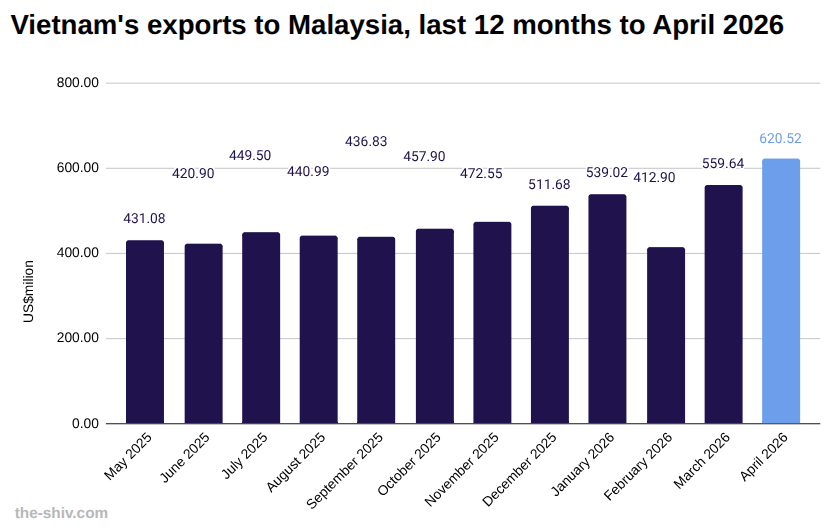
In April, Vietnam exported US$621 million worth of goods to Malaysia, up 10.88 percent over March, according to preliminary data from Vietnam’s General Department of Customs.
So far this year, Vietnam has exported US$2,139 million worth of goods to Malaysia.
Vietnam-Malaysia trade relations
Vietnam and Malaysia maintain strong trade relations, supported by regional integration and shared participation in ASEAN frameworks.
Bilateral trade is driven by Vietnam’s exports of electronics, machinery, and agricultural products, alongside imports of petroleum, chemicals, and industrial inputs from Malaysia.
Supply chain linkages between the two economies continue to deepen, particularly in manufacturing and energy-related sectors.
Ongoing cooperation and trade facilitation measures are expected to support further growth in bilateral trade in the coming years.
Explore starting a business in Vietnam→
The data
Vietnam trade with Malaysia year to date April 2026 US$m
| April | March | Change | YTD | |
| Imports | 1,702.87 | 1,185.48 | 43.64% | 4,862.34 |
| Exports | 620.52 | 559.64 | 10.88% | 2,139.07 |
| Total | 2,323.39 | 1,745.12 | 33.14% | 7,001.41 |
| Balance | -1,082.35 | -625.84 | 72.94% | -2,723.27 |
Vietnam exports to Malaysia in April 2026 US$m
| April | March | Change | YTD | |
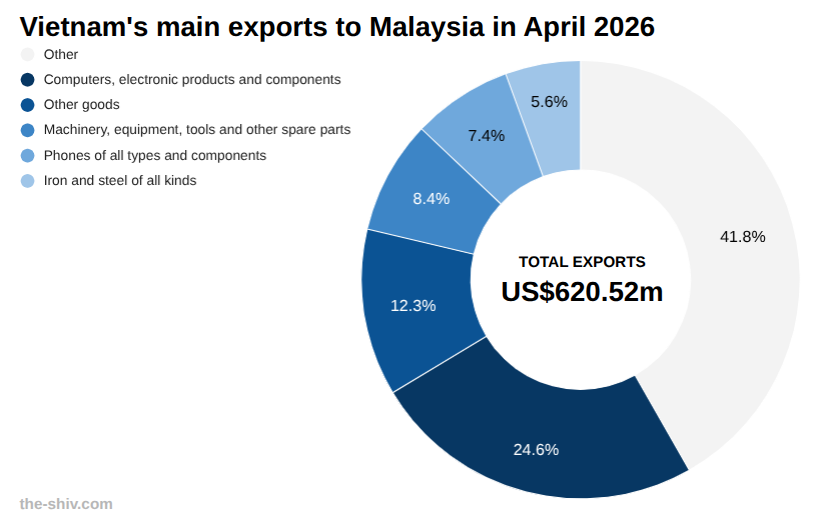
| Total | 620.52 | 559.64 | 10.88% | 2,139.07 |
| Computers, electronic products and components | 152.69 | 126.27 | 20.92% | 393.60 |
| Other goods | 76.63 | 49.47 | 54.89% | 242.96 |
| Machinery, equipment, tools and other spare parts | 51.94 | 56.64 | -8.31% | 205.41 |
| Phones of all types and components | 45.65 | 63.56 | -28.18% | 187.28 |
| Iron and steel of all kinds | 34.49 | 42.23 | -18.32% | 172.63 |
| Chemicals | 22.33 | 10.89 | 105.15% | 77.88 |
| Rice | 20.00 | 25.52 | -21.61% | 73.45 |
| Coffee | 19.44 | 19.14 | 1.55% | 70.67 |
| Wood and wood products | 17.47 | 14.21 | 22.96% | 55.25 |
| Fertilizers of all kinds | 16.93 | 6.95 | 143.71% | 37.78 |
| Transportation vehicles and spare parts | 16.26 | 13.29 | 22.36% | 91.84 |
| Textiles and garments | 15.29 | 13.13 | 16.50% | 57.86 |
| Seafood | 14.93 | 11.74 | 27.08% | 47.00 |
| Chemical products | 14.70 | 13.29 | 10.60% | 48.13 |
| Plastic raw materials | 14.04 | 8.97 | 56.58% | 33.08 |
| Fruits and vegetables | 12.48 | 13.55 | -7.94% | 48.97 |
| Footwear of all kinds | 10.39 | 6.85 | 51.56% | 33.85 |
| Animal feed and raw materials | 10.11 | 9.77 | 3.42% | 38.74 |
| Iron and steel products | 7.42 | 8.39 | -11.56% | 26.88 |
| Clinker and cement | 7.41 | 3.39 | 118.46% | 24.87 |
| Plastic products | 7.11 | 6.81 | 4.49% | 23.76 |
| Glass and glass products | 6.71 | 5.17 | 29.74% | 19.68 |
| Paper and paper products | 5.35 | 6.91 | -22.56% | 23.39 |
| Electrical wires and cables | 2.79 | 3.42 | -18.53% | 12.91 |
| Fibers and yarns of all kinds | 2.35 | 2.42 | -2.67% | 7.40 |
| Handbags, wallets, suitcases, hats, umbrellas. | 1.89 | 1.59 | 18.61% | 7.33 |
| Ore and other minerals | 1.83 | 0.09 | 1968.10% | 2.07 |
| Confectionery and cereal products | 1.70 | 2.17 | -21.90% | 7.46 |
| Pepper | 1.58 | 1.51 | 4.50% | 5.56 |
| Cassava and cassava products | 0.00 | 0.00 | -21.43% | 7.69 |
| Rubber products | 1.36 | 1.34 | 1.36% | 4.47 |
| Rubber | 1.27 | 3.95 | -67.96% | 18.99 |
| Toys, sporting goods and parts | 1.16 | 2.80 | -58.56% | 5.88 |
| Ceramic products | 0.90 | 0.64 | 41.38% | 2.96 |
| Furniture made from materials other than wood. | 0.83 | 0.42 | 99.97% | 1.89 |
| Other common metals | 0.80 | 0.72 | 10.45% | 2.83 |
| Tea | 0.50 | 0.48 | 3.18% | 1.64 |
| Gasoline and diesel fuel of all kinds | 0.30 | 0.03 | 1053.82% | 15.04 |