
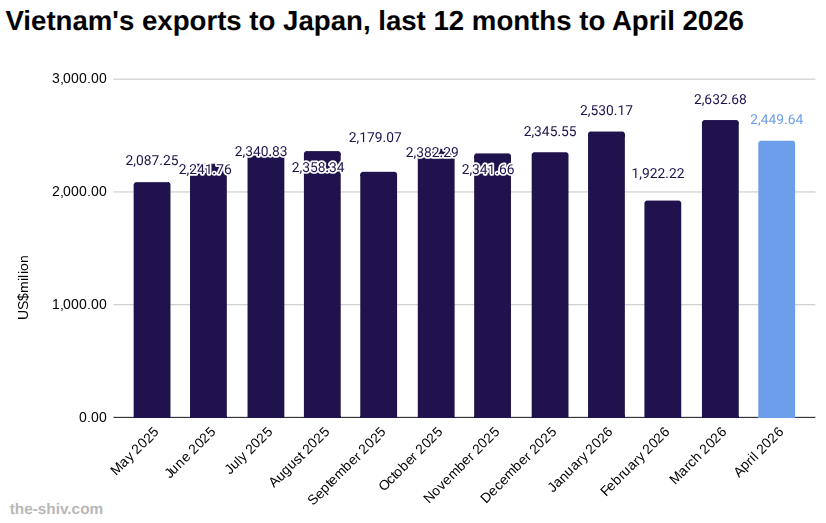
In April, Vietnam exported US$2,450 million worth of goods to Japan, down 6.95 percent from March, according to preliminary data from Vietnam’s General Department of Customs.
So far this year, Vietnam has exported US$9,528 million worth of goods to Japan.
Vietnam-Japan trade relations
Vietnam and Japan have built a long-standing economic partnership, underpinned by trade, investment, and development cooperation.
Bilateral trade has been supported by agreements such as the Vietnam–Japan Economic Partnership Agreement and broader regional frameworks, reducing tariffs and facilitating market access.
Japan is a major investor in Vietnam, particularly in manufacturing, infrastructure, and high-value industries, reinforcing supply chain integration between the two economies.
Trade flows are complementary, with Vietnam exporting electronics, textiles, and agricultural products, while importing machinery, technology, and industrial inputs from Japan.
Explore starting a business in Vietnam→
The data
Vietnam trade with Japan year to date April 2026 US$m
| April | March | Change | YTD | |
| Imports | 2,328.13 | 2,433.66 | -4.34% | 8,979.85 |
| Exports | 2,449.64 | 2,632.68 | -6.95% | 9,527.54 |
| Total | 4,777.77 | 5,066.34 | -5.70% | 18,507.39 |
| Balance | 121.51 | 199.03 | -38.95% | 547.69 |
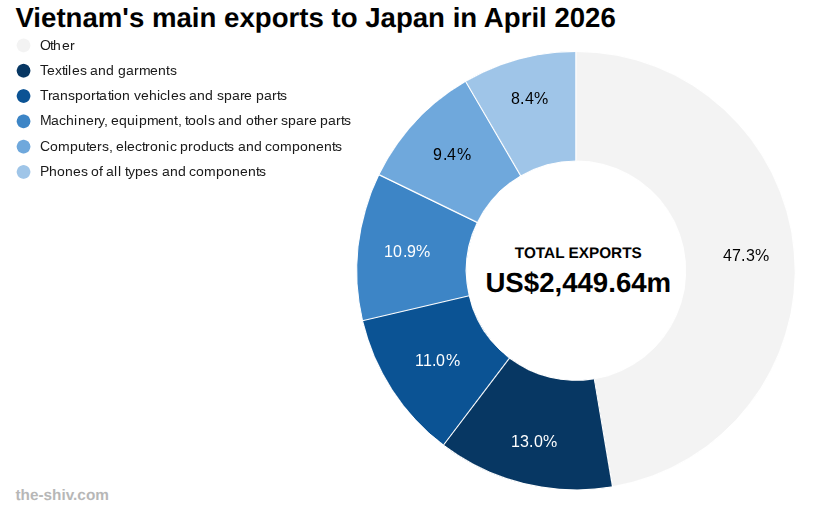
Vietnam exports to Japan in April 2026 US$m
| April | March | Change | YTD | |
| Total | 2,449.64 | 2,632.68 | -6.95% | 9,527.54 |
| Textiles and garments | 318.79 | 383.11 | -16.79% | 1,316.16 |
| Transportation vehicles and spare parts | 269.26 | 294.90 | -8.70% | 1,077.05 |
| Machinery, equipment, tools and other spare parts | 266.65 | 277.54 | -3.92% | 983.24 |
| Computers, electronic products and components | 229.91 | 184.59 | 24.55% | 743.95 |
| Phones of all types and components | 205.77 | 257.62 | -20.13% | 912.54 |
| Wood and wood products | 190.15 | 190.40 | -0.13% | 731.77 |
| Other goods | 166.01 | 179.81 | -7.68% | 653.70 |
| Seafood | 134.35 | 132.22 | 1.61% | 499.72 |
| Footwear of all kinds | 89.15 | 73.07 | 22.01% | 365.31 |
| Toys, sporting goods and parts | 77.52 | 145.11 | -46.58% | 365.52 |
| Chemicals | 72.95 | 64.11 | 13.79% | 224.76 |
| Plastic products | 63.99 | 69.32 | -7.69% | 251.70 |
| Iron and steel products | 48.63 | 52.66 | -7.64% | 188.63 |
| Coffee | 47.44 | 63.67 | -25.49% | 218.45 |
| Plastic raw materials | 39.66 | 24.13 | 64.36% | 96.42 |
| Electrical wires and cables | 37.35 | 39.10 | -4.48% | 137.33 |
| Handbags, wallets, suitcases, hats, umbrellas. | 28.04 | 32.02 | -12.42% | 132.10 |
| Fruits and vegetables | 20.65 | 23.39 | -11.68% | 78.79 |
| Rubber products | 14.43 | 14.77 | -2.29% | 55.96 |
| Gemstones, precious metals and products | 12.13 | 13.17 | -7.92% | 45.52 |
| Chemical products | 11.76 | 13.22 | -11.00% | 46.36 |
| Cameras, camcorders, and accessories | 10.96 | 16.67 | -34.26% | 55.17 |
| Confectionery and cereal products | 10.46 | 13.17 | -20.57% | 47.69 |
| Raw materials for textiles, garments, leather, and footwear. | 9.88 | 11.63 | -15.03% | 42.97 |
| Iron and steel of all kinds | 9.11 | 6.81 | 33.68% | 27.98 |
| Fibers and yarns of all kinds | 8.55 | 7.61 | 12.43% | 28.52 |
| Coal of all kinds | 8.14 | 1.16 | 601.07% | 20.64 |
| Cashew | 7.58 | 8.57 | -11.57% | 28.85 |
| Ceramic products | 7.37 | 7.27 | 1.30% | 27.67 |
| Paper and paper products | 6.30 | 7.07 | -10.83% | 25.96 |
| Other common metals | 5.88 | 3.52 | 67.17% | 17.43 |
| Curtain fabrics, other technical fabrics | 0.00 | 0.00 | 27.40% | 18.28 |
| Products made from rattan, bamboo, sedge, and mats. | 4.62 | 4.67 | -0.96% | 17.06 |
| Glass and glass products | 3.21 | 1.27 | 153.54% | 9.28 |
| Animal feed and raw materials | 1.97 | 2.39 | -17.53% | 8.10 |
| Fertilisers of all kinds | 1.63 | 0.74 | 121.32% | 3.31 |
| Pepper | 1.58 | 2.94 | -46.40% | 7.09 |
| Rubber | 1.50 | 1.45 | 3.71% | 6.09 |
| Cassava and cassava products | 0.00 | 0.00 | -10.43% | 3.28 |
| Ore and other minerals | 0.00 | 2.64 | -100.00% | 7.19 |