
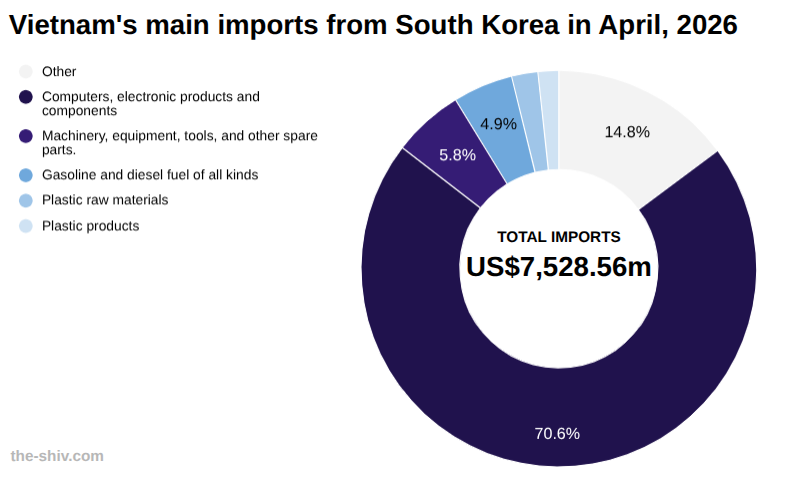
In April, Vietnam imported US$7,528.56 million worth of goods from South Korea, up from US$7,073.94 million in March, a change of 6.43 percent, according to preliminary data from Vietnam’s General Department of Customs.
So far this year, Vietnam has imported US$26,316 million worth of goods from South Korea.

Vietnam-South Korea trade relations
Vietnam and South Korea have developed one of Southeast Asia’s closest economic partnerships, driven by deep trade and investment ties.
Bilateral trade has expanded rapidly under the Vietnam–Korea Free Trade Agreement, which has reduced tariffs and strengthened supply chain integration between the two economies.
South Korea is one of Vietnam’s largest foreign investors, particularly in electronics, manufacturing, and consumer goods, with major conglomerates anchoring export production.
Trade flows are highly complementary, with Vietnam exporting electronics, textiles, and agricultural products, while importing machinery, components, and industrial inputs from South Korea.
Explore starting a business in Vietnam→
The data
Vietnam imports from South Korea in April US$m
| April | March | MoM | YTD | |
| Total | 7,528.56 | 7,073.94 | 6.43% | 26,315.74 |
| Other | 245.17 | 277.64 | -11.70% | 950.59 |
| Computers, electronic products and components | 5,317.14 | 4,697.95 | 13.18% | 18,041.86 |
| Machinery, equipment, tools, and other spare parts. | 435.33 | 420.99 | 3.41% | 1,586.50 |
| Gasoline and diesel fuel of all kinds | 369.25 | 540.56 | -31.69% | 1,304.62 |
| Plastic raw materials | 162.04 | 190.61 | -14.99% | 654.49 |
| Plastic products | 127.89 | 125.88 | 1.59% | 499.80 |
| Fabrics of all kinds | 113.74 | 107.30 | 6.00% | 423.42 |
| Iron and steel of all kinds | 94.15 | 77.24 | 21.89% | 391.99 |
| Automotive components and parts | 92.21 | 81.76 | 12.77% | 311.00 |
| Chemical products | 83.65 | 82.38 | 1.55% | 305.10 |
| Chemicals | 65.33 | 51.84 | 26.03% | 206.53 |
| Iron and steel products | 59.74 | 63.81 | -6.38% | 248.78 |
| Electrical wires and cables | 42.61 | 46.25 | -7.88% | 162.76 |
| Raw materials for textiles, garments, leather, and footwear. | 40.06 | 32.41 | 23.60% | 135.26 |
| Gemstones, precious metals and products | 37.62 | 27.03 | 39.21% | 134.12 |
| Rubber | 31.35 | 31.23 | 0.39% | 112.06 |
| Fragrances, cosmetics and hygiene products | 28.08 | 27.69 | 1.40% | 109.48 |
| Phones of all types and components | 27.31 | 30.40 | -10.18% | 126.87 |
| Other petroleum products | 22.48 | 31.00 | -27.47% | 112.48 |
| Paper of all kinds | 20.06 | 23.16 | -13.39% | 81.73 |
| Pharmaceuticals | 12.75 | 11.75 | 8.57% | 41.19 |
| Glass and glass products | 12.32 | 10.32 | 19.34% | 40.82 |
| Rubber products | 9.86 | 8.60 | 14.65% | 34.88 |
| Fibers and yarns of all kinds | 8.88 | 9.79 | -9.29% | 35.18 |
| Fertilizers of all kinds | 7.74 | 3.24 | 139.26% | 15.84 |
| Pesticides and raw materials | 6.95 | 10.03 | -30.68% | 23.15 |
| Seafood | 6.91 | 6.26 | 10.46% | 23.92 |
| Other food products | 6.90 | 0.00 | 0.00% | 26.04 |
| Cameras, camcorders, and accessories | 6.15 | 8.23 | -25.25% | 19.92 |
| Liquefied petroleum gas | 6.09 | 4.04 | 50.66% | 22.37 |
| Household electrical appliances and components | 5.51 | 5.36 | 2.82% | 22.23 |
| Animal feed and raw materials | 4.68 | 6.31 | -25.71% | 18.65 |
| Paper products | 4.14 | 4.96 | -16.55% | 17.43 |
| Confectionery and cereal products | 4.08 | 6.24 | -34.65% | 20.49 |
| Fruits and vegetables | 3.46 | 5.29 | -34.63% | 17.76 |
| Milk and dairy products | 2.09 | 1.98 | 5.90% | 6.97 |
| Ore and other minerals | 1.95 | 2.50 | -22.18% | 12.97 |
| Wood and wood products | 0.98 | 0.55 | 77.59% | 4.71 |
| Complete automobiles of all types | 0.80 | 0.39 | 105.75% | 7.22 |
| Cotton of all kinds | 0.53 | 0.19 | 171.82% | 1.42 |
| Animal and vegetable oils and fats | 0.49 | 0.54 | -9.43% | 2.21 |
| Pharmaceutical raw materials | 0.08 | 0.25 | -66.98% | 0.92 |
Vietnam trade with South Korea year to date US$m
| April | March | MoM | YTD | |
| Imports | 7,528.56 | 7,073.94 | 6.43% | 26,315.74 |
| Exports | 2,567.89 | 3,018.94 | -14.94% | 10,756.56 |
| Total | 10,096.45 | 10,092.89 | 0.04% | 37,072.30 |
| Balance | -4,960.67 | -4,055.00 | 22.33% | -15,559.18 |