
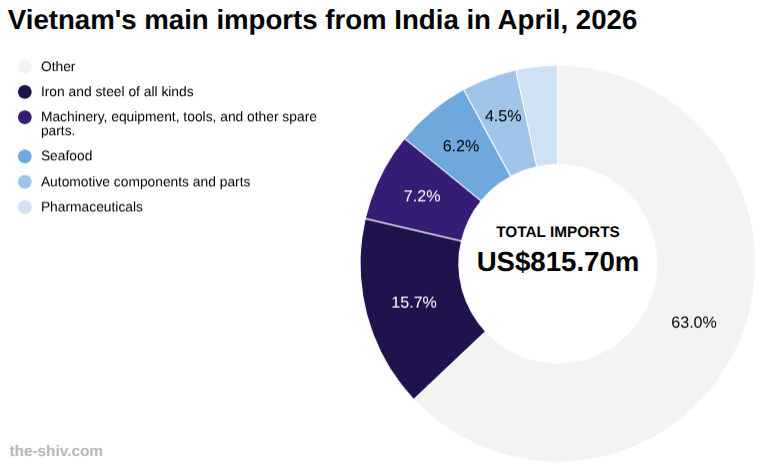
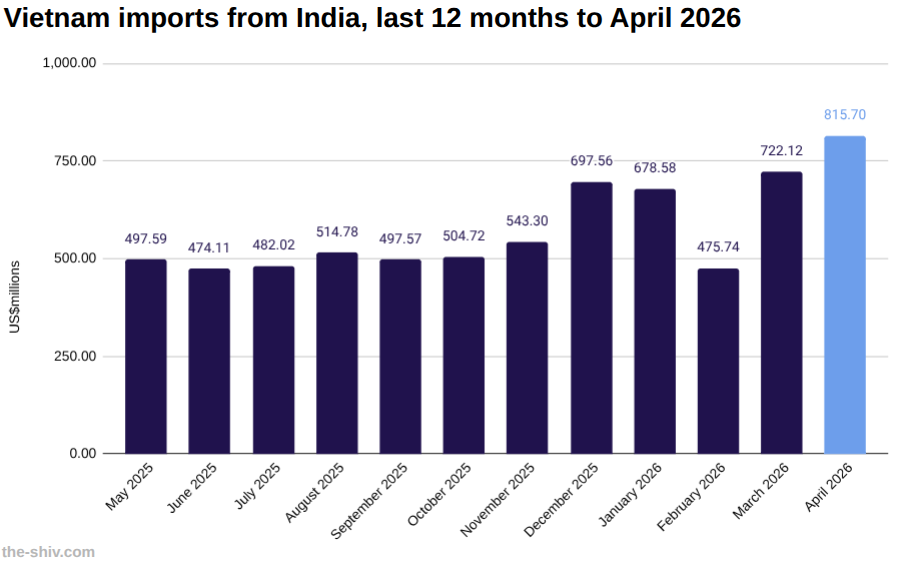
In April, Vietnam imported US$815.70 million worth of goods from India, up from US$722.12 million in March, a change of 12.96 percent, according to preliminary data from Vietnam’s General Department of Customs.
So far this year, Vietnam has imported US$2,706 million worth of goods from India.
Vietnam-India trade relations
Vietnam and India have steadily expanded economic ties since establishing diplomatic relations in 1972, with trade gaining momentum after Vietnam’s economic reforms and deeper regional integration.
Bilateral engagement strengthened further with the ASEAN-India Free Trade Agreement, which reduced tariffs and facilitated greater flows of goods between the two economies.
Both countries have also upgraded their relationship to a Comprehensive Strategic Partnership, reflecting broader cooperation across trade, investment, and supply chains.
Trade agreements and policy coordination continue to support growth in key sectors such as electronics, agriculture, and energy, while reinforcing long-term economic cooperation.
Explore starting a business in Vietnam→
The data
Vietnam imports from India in April US$m
| April | March | MoM | YTD | |
| Total | 815.70 | 722.12 | 12.96% | 2,706.34 |
| Other | 325.89 | 273.54 | 19.14% | 1,032.47 |
| Iron and steel of all kinds | 127.77 | 90.13 | 41.76% | 308.12 |
| Machinery, equipment, tools, and other spare parts. | 58.91 | 74.40 | -20.82% | 239.34 |
| Seafood | 50.63 | 43.09 | 17.49% | 168.32 |
| Automotive components and parts | 36.69 | 38.74 | -5.31% | 149.38 |
| Pharmaceuticals | 27.86 | 32.67 | -14.71% | 99.12 |
| Animal feed and raw materials | 26.11 | 16.71 | 56.23% | 94.08 |
| Chemicals | 21.94 | 19.96 | 9.92% | 73.55 |
| Pesticides and raw materials | 20.62 | 15.17 | 35.93% | 54.33 |
| Chemical products | 17.28 | 16.83 | 2.67% | 65.31 |
| Fibers and yarns of all kinds | 16.49 | 16.56 | -0.48% | 57.91 |
| Gemstones, precious metals and products | 10.55 | 13.76 | -23.32% | 46.90 |
| Cotton of all kinds | 9.02 | 7.29 | 23.80% | 33.25 |
| Fabrics of all kinds | 7.45 | 7.41 | 0.49% | 25.02 |
| Raw materials for textiles, garments, leather, and footwear. | 7.42 | 9.44 | -21.45% | 30.92 |
| Iron and steel products | 7.01 | 6.17 | 13.52% | 24.67 |
| Fruits and vegetables | 6.08 | 5.98 | 1.68% | 31.77 |
| Computers, electronic products and components | 5.91 | 3.57 | 65.46% | 14.77 |
| Pharmaceutical raw materials | 5.78 | 5.03 | 14.99% | 18.59 |
| Ore and other minerals | 4.93 | 3.76 | 31.17% | 15.34 |
| Plastic raw materials | 4.87 | 3.94 | 23.74% | 21.57 |
| Plastic products | 4.48 | 4.51 | -0.58% | 16.82 |
| Rubber | 2.98 | 4.10 | -27.37% | 13.16 |
| Other petroleum products | 2.51 | 1.35 | 85.55% | 42.33 |
| Animal and vegetable oils and fats | 2.43 | 2.27 | 7.00% | 11.50 |
| Rubber products | 2.00 | 2.36 | -15.50% | 7.85 |
| Paper of all kinds | 1.33 | 1.76 | -24.11% | 5.75 |
| Phones of all types and components | 0.43 | 0.54 | -20.43% | 1.46 |
| Fertilisers of all kinds | 0.33 | 0.32 | 4.84% | 0.98 |
| Complete automobiles of all types | 0.00 | 0.42 | -100.00% | 1.31 |
| Tobacco raw materials | 0.00 | 0.32 | -100.00% | 0.44 |
Vietnam trade with India year to date US$m
| April | March | MoM | YTD | |
| Imports | 815.70 | 722.12 | 12.96% | 2,706.34 |
| Exports | 966.29 | 1,125.36 | -14.13% | 3,926.40 |
| Total | 1,782.00 | 1,847.48 | -3.54% | 6,632.73 |
| Balance | 150.59 | 403.24 | -62.65% | 1,220.06 |