
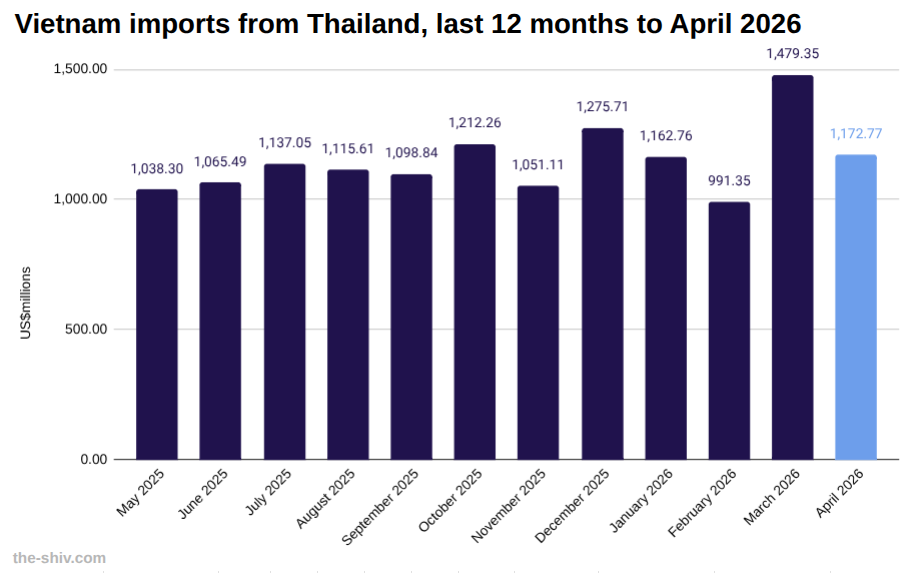
In April, Vietnam imported US$1,172.77 million worth of goods from Thailand, down from US$1,479.35 million in March, a change of -20.72 percent, according to preliminary data from Vietnam’s General Department of Customs.
So far this year, Vietnam has imported US$4,836 million worth of goods from Thailand.
The data
Vietnam imports from Thailand in April US$m
| April | March | MoM | YTD | |
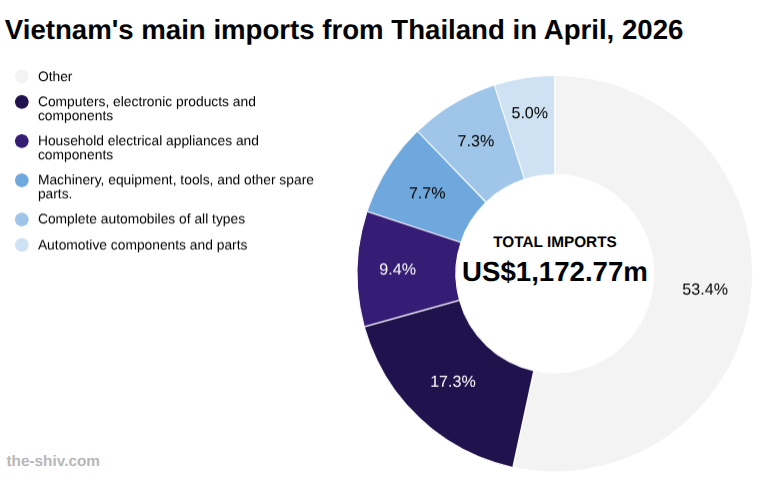
| Total | 1,172.77 | 1,479.35 | -20.72% | 4,835.97 |
| Other | 235.05 | 311.98 | -24.66% | 942.62 |
| Computers, electronic products and components | 202.67 | 218.58 | -7.28% | 796.15 |
| Machinery, equipment, tools, and other spare parts. | 110.32 | 144.17 | -23.48% | 416.31 |
| Machinery, equipment, tools, and other spare parts. | 90.11 | 121.75 | -25.99% | 385.02 |
| Complete automobiles of all types | 85.29 | 115.62 | -26.23% | 361.09 |
| Automotive components and parts | 58.11 | 85.82 | -32.28% | 256.84 |
| Plastic raw materials | 55.89 | 60.17 | -7.12% | 218.18 |
| Chemical products | 34.66 | 41.32 | -16.11% | 132.07 |
| Chemicals | 30.62 | 38.58 | -20.63% | 118.05 |
| Rubber | 22.82 | 18.98 | 20.27% | 78.98 |
| Plastic products | 20.81 | 26.61 | -21.80% | 87.48 |
| Raw materials for textiles, garments, leather, and footwear. | 19.86 | 26.26 | -24.38% | 85.31 |
| Fabrics of all kinds | 16.91 | 21.05 | -19.63% | 71.45 |
| Electrical wires and cables | 15.22 | 14.12 | 7.77% | 53.76 |
| Fragrances, cosmetics and hygiene products | 15.18 | 17.54 | -13.45% | 66.37 |
| Animal feed and raw materials | 14.12 | 13.74 | 2.77% | 43.81 |
| Ore and other minerals | 12.80 | 29.22 | -56.18% | 52.01 |
| Iron and steel products | 10.83 | 15.17 | -28.60% | 52.29 |
| Wood and wood products | 10.76 | 10.14 | 6.08% | 38.01 |
| Paper of all kinds | 10.72 | 15.97 | -32.87% | 47.01 |
| Pharmaceuticals | 9.13 | 7.98 | 14.50% | 27.80 |
| Other petroleum products | 9.11 | 6.57 | 38.71% | 31.55 |
| Rubber products | 8.46 | 10.39 | -18.51% | 34.75 |
| Other food products | 8.45 | 0.00 | 0.00% | 29.63 |
| Cameras, camcorders, and accessories | 8.32 | 11.99 | -30.60% | 37.94 |
| Fibers and yarns of all kinds | 7.75 | 11.35 | -31.74% | 38.61 |
| Milk and dairy products | 6.78 | 6.04 | 12.25% | 23.28 |
| Animal and vegetable oils and fats | 6.37 | 10.55 | -39.63% | 24.85 |
| Gemstones, precious metals and products | 6.28 | 9.95 | -36.89% | 25.28 |
| Iron and steel of all kinds | 5.73 | 8.20 | -30.10% | 22.96 |
| Paper products | 5.44 | 9.03 | -39.73% | 24.32 |
| Glass and glass products | 5.09 | 4.58 | 11.01% | 16.73 |
| Confectionery and cereal products | 4.57 | 7.10 | -35.74% | 21.88 |
| Pesticides and raw materials | 3.70 | 10.46 | -64.60% | 19.09 |
| Fruits and vegetables | 3.24 | 5.46 | -40.62% | 19.17 |
| Seafood | 1.40 | 2.58 | -45.61% | 8.40 |
| Fertilisers of all kinds | 0.18 | 0.31 | -42.66% | 1.14 |
| Gasoline and diesel fuel of all kinds | 0.00 | 10.03 | -100.00% | 125.76 |
Vietnam trade with Thailand year to date US$m
| April | March | MoM | YTD | |
| Imports | 1,172.77 | 1,479.35 | -20.72% | 4,835.97 |
| Exports | 1,086.14 | 1,057.37 | 2.72% | 3,759.16 |
| Total | 2,258.91 | 2,536.71 | -10.95% | 8,595.14 |
| Balance | -86.62 | -421.98 | -79.47% | -1,076.81 |