
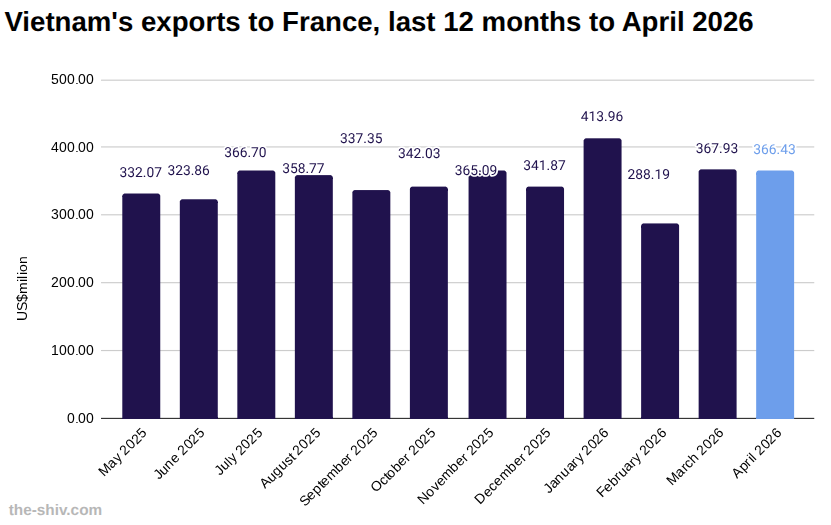
In April, Vietnam exported US$366 million worth of goods to France, down 0.41 percent over March, according to preliminary data from Vietnam’s General Department of Customs.
So far this year, Vietnam has exported US$1,438 million worth of goods to France.
Vietnam-France trade relations
Vietnam and France maintain longstanding trade relations underpinned by the EU-Vietnam Free Trade Agreement (EVFTA).
The agreement has reduced tariffs across a wide range of goods, supporting growth in bilateral trade flows.
France is a key European market for Vietnamese exports, particularly in electronics, footwear, and machinery.
Vietnam imports pharmaceuticals, aerospace products, and high-value machinery from France.
Trade ties are supported by broader economic cooperation, including investment, technology transfer, and development partnerships.
Explore starting a business in Vietnam→
The data
Vietnam trade with France year to date April 2026 US$m
| April | March | Change | YTD | |
| Imports | 246.00 | 177.31 | 38.74% | 974.26 |
| Exports | 366.43 | 367.93 | -0.41% | 1,438.13 |
| Total | 612.44 | 545.24 | 12.33% | 2,412.39 |
| Balance | 120.43 | 190.62 | -36.82% | 463.87 |
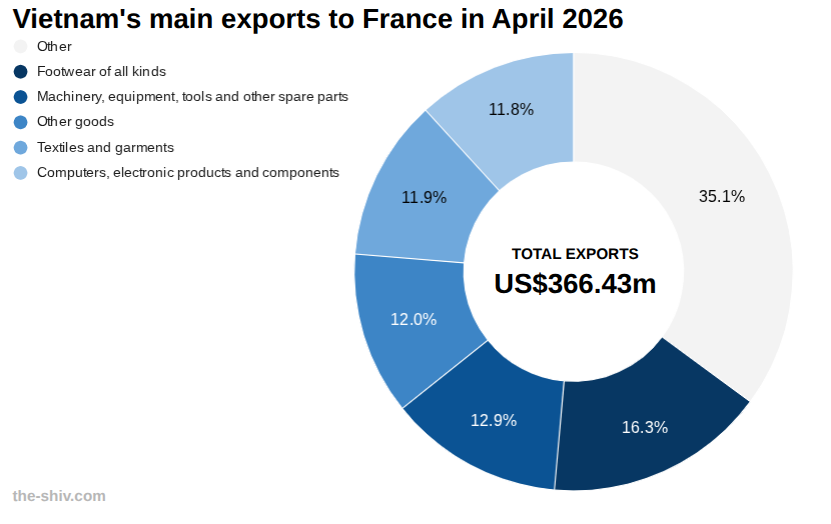
Vietnam exports to France in April 2026 US$m
| April | March | Change | YTD | |
| Total | 366.43 | 367.93 | -0.41% | 1,438.13 |
| Footwear of all kinds | 59.69 | 63.54 | -6.05% | 233.49 |
| Machinery, equipment, tools and other spare parts | 47.15 | 42.46 | 11.05% | 156.66 |
| Other goods | 44.05 | 40.70 | 8.24% | 152.21 |
| Textiles and garments | 43.68 | 37.93 | 15.15% | 146.52 |
| Computers, electronic products and components | 43.22 | 47.51 | -9.03% | 152.01 |
| Phones of all types and components | 25.85 | 43.95 | -41.18% | 226.63 |
| Transportation vehicles and spare parts | 21.66 | 7.85 | 175.90% | 48.95 |
| Handbags, wallets, suitcases, hats, umbrellas. | 16.63 | 12.20 | 36.32% | 48.07 |
| Wood and wood products | 11.64 | 10.74 | 8.39% | 46.24 |
| Coffee | 10.14 | 15.12 | -32.95% | 61.59 |
| Plastic products | 5.59 | 5.57 | 0.38% | 19.33 |
| Cashew | 5.48 | 7.01 | -21.88% | 21.37 |
| Fruits and vegetables | 4.84 | 5.80 | -16.63% | 20.40 |
| Toys, sporting goods and parts | 3.79 | 2.84 | 33.60% | 11.05 |
| Seafood | 3.68 | 5.12 | -28.11% | 17.19 |
| Gemstones, precious metals and products | 3.40 | 3.61 | -5.75% | 15.02 |
| Pepper | 3.12 | 2.82 | 10.70% | 9.88 |
| Confectionery and cereal products | 2.68 | 3.61 | -25.67% | 12.88 |
| Products made from rattan, bamboo, sedge, and mats. | 2.48 | 3.03 | -18.20% | 11.23 |
| Iron and steel products | 2.08 | 1.93 | 7.91% | 7.83 |
| Rubber products | 1.75 | 1.32 | 32.11% | 5.12 |
| Ceramic products | 1.59 | 1.43 | 11.55% | 5.11 |
| Raw materials for textiles, garments, leather, and footwear. | 0.79 | 0.93 | -15.62% | 4.22 |
| Rubber | 0.59 | 0.32 | 87.34% | 1.91 |
| Electrical wires and cables | 0.59 | 0.34 | 74.97% | 2.09 |
| Rice | 0.25 | 0.24 | 4.54% | 1.12 |