
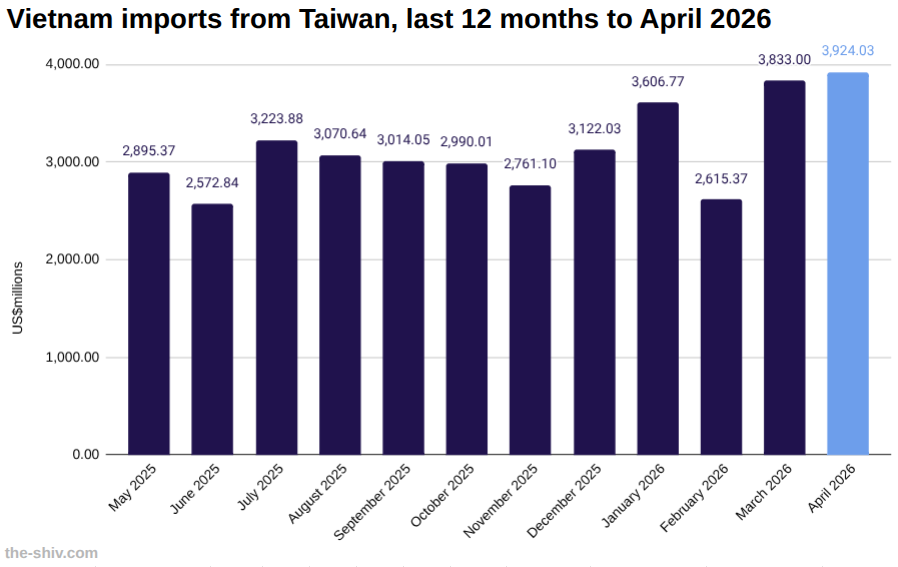
In April, Vietnam imported US$3,924.03 million worth of goods from Taiwan, up from US$3,833.00 million in March, a change of 2.38 percent, according to preliminary data from Vietnam’s General Department of Customs.
So far this year, Vietnam has imported US$14,021 million worth of goods from Taiwan.
Vietnam-Taiwan trade relations
Vietnam and Taiwan have developed strong economic ties over the past decades, driven primarily by trade, investment, and manufacturing linkages.
Taiwan is one of Vietnam’s largest foreign investors, with companies active in electronics, textiles, and industrial production.
Bilateral trade has expanded steadily, supported by supply chain integration and Vietnam’s role as a key manufacturing hub.
Taiwan exports machinery, electronics, and intermediate goods to Vietnam, while importing products such as electronics, footwear, and agricultural goods.
Explore starting a business in Vietnam→
The data
Vietnam imports from Taiwan in April US$m
| April | March | MoM | YTD | |
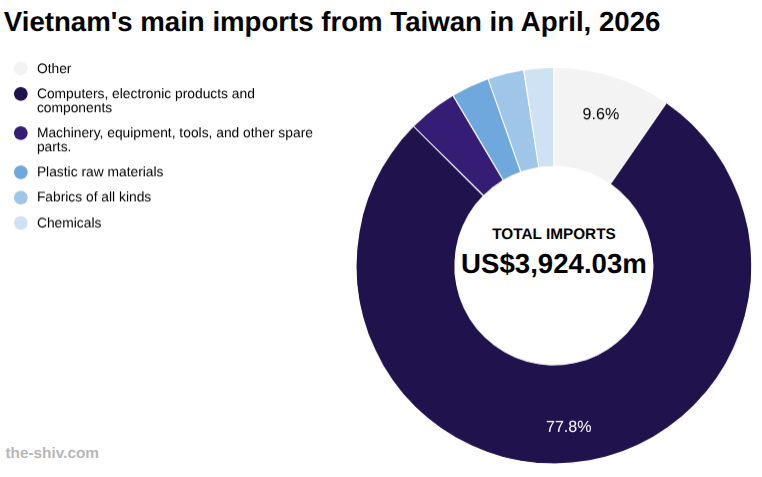
| Total | 3,924.03 | 3,833.00 | 2.38% | 14,021.44 |
| Other | 80.02 | 89.98 | -11.07% | 296.17 |
| Computers, electronic products and components | 3,052.49 | 2,889.79 | 5.63% | 10,751.57 |
| Machinery, equipment, tools, and other spare parts. | 158.79 | 149.09 | 6.50% | 564.74 |
| Plastic raw materials | 122.54 | 103.74 | 18.12% | 378.32 |
| Fabrics of all kinds | 116.09 | 141.39 | -17.90% | 500.38 |
| Chemicals | 95.96 | 66.77 | 43.71% | 282.15 |
| Iron and steel of all kinds | 53.66 | 63.78 | -15.87% | 201.06 |
| Cameras, camcorders, and accessories | 53.51 | 53.09 | 0.78% | 224.12 |
| Chemical products | 45.09 | 42.88 | 5.16% | 168.26 |
| Plastic products | 31.38 | 34.05 | -7.86% | 121.68 |
| Raw materials for textiles, garments, leather, and footwear. | 24.91 | 29.01 | -14.13% | 107.07 |
| Iron and steel products | 16.46 | 16.55 | -0.55% | 61.27 |
| Fibers and yarns of all kinds | 14.75 | 15.29 | -3.51% | 54.35 |
| Rubber | 12.19 | 13.40 | -9.05% | 42.04 |
| Other petroleum products | 8.76 | 8.67 | 1.06% | 35.37 |
| Seafood | 6.10 | 8.59 | -28.94% | 28.03 |
| Paper of all kinds | 5.27 | 6.66 | -20.81% | 20.47 |
| Animal feed and raw materials | 4.32 | 3.83 | 12.99% | 13.13 |
| Electrical wires and cables | 3.61 | 3.21 | 12.30% | 13.04 |
| Other food products | 2.69 | 0.00 | 0.00% | 12.57 |
| Rubber products | 2.54 | 2.93 | -13.27% | 9.90 |
| Gemstones, precious metals and products | 2.23 | 1.13 | 97.00% | 4.20 |
| Phones of all types and components | 1.69 | 1.44 | 17.41% | 5.21 |
| Paper products | 1.56 | 1.75 | -10.79% | 6.42 |
| Ore and other minerals | 1.35 | 10.46 | -87.08% | 22.23 |
| Fertilizers of all kinds | 1.31 | 1.60 | -18.57% | 6.52 |
| Household electrical appliances and components | 1.30 | 1.68 | -22.48% | 5.11 |
| Glass and glass products | 0.99 | 1.41 | -29.97% | 4.09 |
| Scrap iron and steel | 0.66 | 0.76 | -13.31% | 2.74 |
| Fragrances, cosmetics and hygiene products | 0.56 | 0.62 | -9.73% | 2.06 |
| Pharmaceuticals | 0.41 | 1.72 | -75.90% | 3.19 |
| Cotton of all kinds | 0.40 | 0.52 | -22.55% | 1.33 |
| Pesticides and raw materials | 0.33 | 1.25 | -74.01% | 2.57 |
| Wood and wood products | 0.12 | 0.18 | -32.15% | 0.47 |
| Gasoline and diesel fuel of all kinds | 0.00 | 65.77 | -100.00% | 69.58 |
Vietnam trade with Taiwan year to date US$m
| April | March | MoM | YTD | |
| Imports | 3,924.03 | 3,833.00 | 2.38% | 14,021.44 |
| Exports | 687.97 | 685.39 | 0.38% | 2,339.49 |
| Total | 4,612.01 | 4,518.39 | 2.07% | 16,360.93 |
| Balance | -3,236.06 | -3,147.61 | 2.81% | -11,681.94 |