
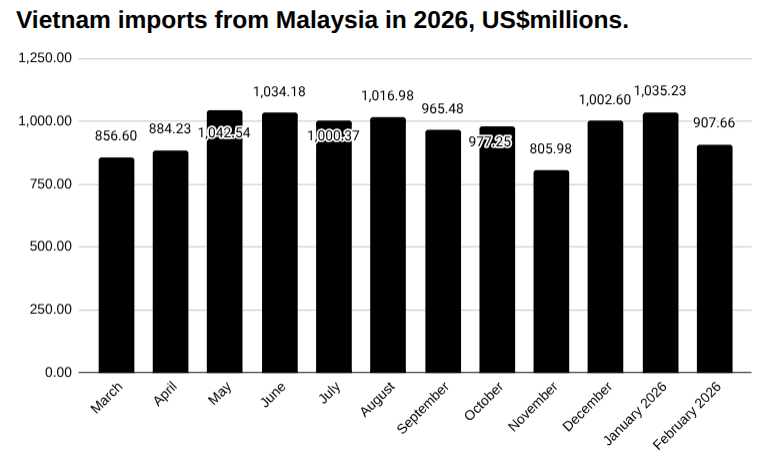
In February, Vietnam imported US$907.66 million worth of goods from Malaysia, down from US$1,035.23 million in January, a change of -12.32 percent, according to preliminary data from Vietnam’s General Department of Customs.
So far this year, Vietnam has imported US$1,944 million worth of goods from Malaysia.
Vietnam imported US$261.30 million worth of computers from Malaysia in February, down from US$307.58 million in January, a change of 15.04 percent.
Vietnam imported US$155.33 million worth of petroleum products from Malaysia in February, down from US$171.82 million in January, a change of 9.60 percent.
Vietnam imported US$134.47 million worth of machinery, equipment, tools, and instruments from Malaysia in February, up from US$124.52 million in January, a change of 7.99 percent.
Vietnam imported US$57.13 million worth of electric consumer products and parts thereof from Malaysia in February, up from US$26.16 million in January, a change of 118.39 percent.
Vietnam imported US$50.43 million worth of chemicals from Malaysia in February, down from US$54.22 million in January, a change of 7.00 percent.
Learn more about manufacturing in Vietnam→
Vietnam’s trade with Malaysia this year
In February, Vietnam imported goods worth US$907.66 million from Malaysia and exported US$412.90 million, bringing total trade to US$1,320.56 million and resulting in a trade deficit of US$494.77 million.
Two-way trade so far this year between Vietnam and Malaysia has reached US$2,896.50 million, with Vietnam importing US$1,944.39 million worth of goods and exporting US$952.12 million.
Discover more about trade in Vietnam→
Vietnam-Malaysia news
Recent developments in trade and investment between the two countries include:
See the latest Vietnam news headlines→
Vietnam-Malaysia trade relations
Vietnam and Malaysia maintain strong trade relations, supported by regional integration and shared participation in ASEAN frameworks.
Bilateral trade is driven by Vietnam’s exports of electronics, machinery, and agricultural products, alongside imports of petroleum, chemicals, and industrial inputs from Malaysia.
Supply chain linkages between the two economies continue to deepen, particularly in manufacturing and energy-related sectors.
Ongoing cooperation and trade facilitation measures are expected to support further growth in bilateral trade in the coming years.
Explore starting a business in Vietnam→
The data
Vietnam imports from Malaysia in February US$m
| February | January | MoM | YTD | |
| Imports | 907.66 | 1,035.23 | -12.32% | 1,944.39 |
| Exports | 412.90 | 539.02 | -23.40% | 952.12 |
| Total | 1,320.56 | 1,574.25 | -16.11% | 2,896.50 |
| Balance | -494.77 | -496.21 | -0.29% | -992.27 |
Vietnam trade with Malaysia year to date US$m
| February | January | MoM | YTD | |
| Total | 907.66 | 1,035.23 | -12.32% | 1,944.39 |
| Computers | 261.30 | 307.58 | -15.04% | 572.62 |
| Petroleum products | 155.33 | 171.82 | -9.60% | 334.45 |
| Machine, equipment, tools and instruments | 134.47 | 124.52 | 7.99% | 259.24 |
| Electric consumer products and parts thereof | 57.13 | 26.16 | 118.39% | 80.91 |
| Chemicals | 50.43 | 54.22 | -7.00% | 104.64 |
| Other products | 39.04 | 36.18 | 7.92% | 75.21 |
| Animal, vegetable fats and oils | 38.50 | 50.63 | -23.96% | 89.12 |
| Other base metals | 26.90 | 43.92 | -38.76% | 70.83 |
| Plastics | 21.55 | 26.27 | -17.99% | 47.82 |
| Chemical products | 17.17 | 20.52 | -16.31% | 37.68 |
| Liquefied petroleum gases (lpg) | 13.84 | 14.76 | -6.21% | 28.59 |
| Paper | 11.83 | 18.46 | -35.94% | 30.29 |
| Fabrics | 8.76 | 10.47 | -16.32% | 19.24 |
| Plastic products | 6.55 | 8.51 | -23.05% | 16.37 |
| Ores and other minerals product | 6.28 | 4.84 | 29.70% | 11.11 |
| Other edible food preparations | 6.07 | 7.96 | -23.72% | 14.04 |
| Insulated wires and cables | 4.05 | 8.29 | -51.18% | 14.87 |
| Glass and glassware | 4.01 | 5.30 | -24.36% | 9.65 |
| Pastries, sweets and cereal products | 3.83 | 6.16 | -37.86% | 9.99 |
| Iron and steel products | 3.77 | 4.84 | -22.17% | 8.61 |
| Rubber products | 3.61 | 4.44 | -18.74% | 8.05 |
| Other petroleum products | 3.56 | 4.72 | -24.52% | 8.29 |
| Animal fodders and animal fodder materials | 3.29 | 15.47 | -78.75% | 7.16 |
| Milk and milk products | 3.26 | 4.00 | -18.63% | 7.26 |
| Pharmaceutical products | 2.99 | 2.59 | 15.27% | 5.58 |
| Other means of transportation, parts and accessories thereof | 2.92 | 0.03 | 9725.86% | 2.95 |
| Insecticides, rodenticides and materials | 2.60 | 1.67 | 56.13% | 4.27 |
| Fishery products | 2.34 | 2.26 | 3.50% | 4.60 |
| Parts and accessories of motor vehicles | 2.14 | 2.02 | 5.63% | 4.16 |
| Textile and footwear materials | 1.98 | 2.15 | -7.89% | 4.12 |
| Iron and steel | 1.67 | 30.08 | -94.45% | 31.75 |
| Other base metal products | 1.35 | 2.37 | -43.00% | 3.73 |
| Yarn | 1.27 | 5.07 | -74.90% | 6.35 |
| Rubber | 1.02 | 1.72 | -40.66% | 2.74 |
| Wood and wooden products | 0.91 | 2.21 | -58.61% | 3.12 |
| Essential oils and resinoids; perfumery, cosmetic or toilet preparations | 0.70 | 1.09 | -36.26% | 1.78 |
| Paper products | 0.62 | 1.31 | -52.77% | 1.93 |
| Fruits and vegetables | 0.27 | 0.37 | -25.93% | 0.64 |
| Tobacco materials | 0.27 | 0.17 | 58.12% | 0.44 |
| Fertilizers | 0.08 | 0.09 | -5.37% | 0.17 |
| Coal | 0.05 | 0.00 | 0.00% | 0.06 |