
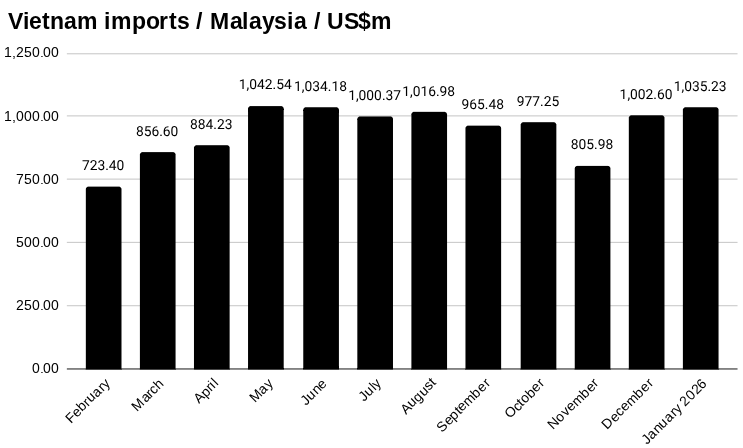
In January, Vietnam imported US$1,035.23 million worth of goods from Malaysia, up from US$1,002.60 million in December, a change of 3.25 percent, according to preliminary data from Vietnam’s General Department of Customs.
So far this year, Vietnam has imported US$1,035 million worth of goods from Malaysia.
Vietnam imported US$307.58 million worth of computers from Malaysia in January. This was down from US$320.71 million in December, a change of -4.10 percent.
Vietnam imported US$171.82 million worth of petroleum products from Malaysia in January. This was up from US$67.34 million in December, a change of 155.17 percent.
Vietnam imported US$124.52 million worth of machines, equipment, tools and instruments from Malaysia in January. This was up from US$117.44 million in December, a change of 6.03 percent.
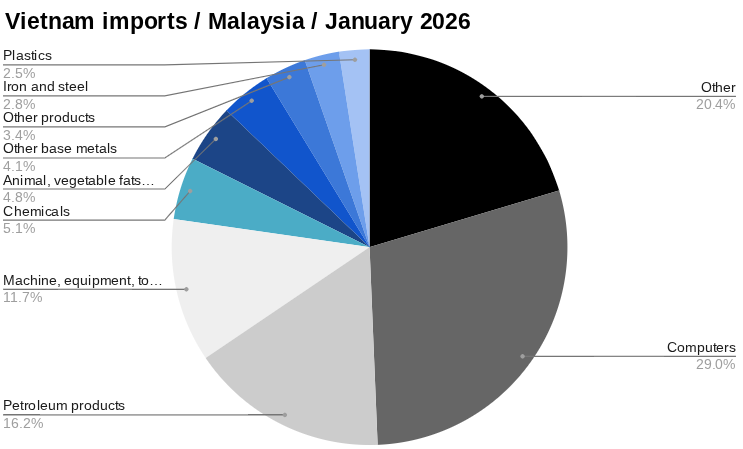
Vietnam imported US$54.22 million worth of chemicals from Malaysia in January. This was down from US$66.81 million in December, a change of -18.84 percent.
Vietnam imported US$50.63 million worth of animal, vegetable fats and oils from Malaysia in January. This was down from US$58.59 million in December, a change of -13.60 percent.
Learn more about manufacturing in Vietnam→
Vietnam exports to Malaysia
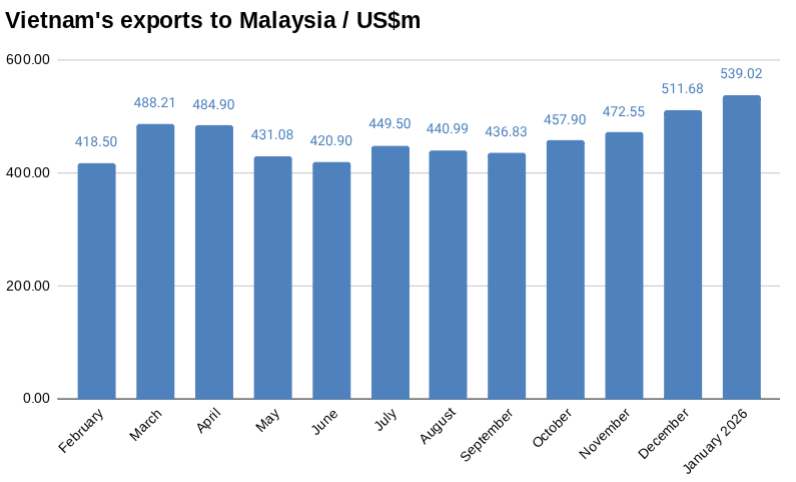
In January, Vietnam exported US$539 million worth of goods to Malaysia, up 5.34 percent over December, according to preliminary data from Vietnam’s General Department of Customs.
So far this year, Vietnam has exported US$539 million worth of goods to Malaysia. Read the full report >>
Vietnam trade with Malaysia
In January, Vietnam imported US$1,035.23 million worth of goods from Malaysia and exported US$539.02 million to Malaysia, for total trade worth US$1,574.25 million, and leaving a trade deficit of US$496.21 million.
Two-way trade so far this year between Vietnam and Malaysia has reached US$1,574 million, with Vietnam importing US$1,035 million worth of goods and exporting US$539 million worth of goods.
Discover more about trade in Vietnam→
Vietnam-Malaysia news
Recent developments involving the two countries include:
Trade remedies Indonesian / Malaysian glass
The Ministry of Industry and Trade, on January 30, 2026, imposed provisional anti-dumping duties on certain clear float glass imported from Indonesia and Malaysia.
The provisional duties range from 15.17 percent to 63.39 percent depending on the producer and exporter, following a complaint filed in May 2025 by domestic manufacturers.
Preliminary findings showed dumped imports caused significant injury to domestic producers, with import volumes rising more than 61.82 percent after the investigation was launched.
See the latest Vietnam news headlines→
Vietnam-Malaysia trade relations
Vietnam and Malaysia established diplomatic relations in 1973 and have since expanded cooperation through trade, investment and regional integration frameworks.
Both countries are members of the Association of Southeast Asian Nations and participate in the ASEAN Free Trade Area, reducing tariffs and facilitating regional supply chains.
Bilateral trade has grown steadily over the past decade, covering electronics, petroleum products, agricultural goods and manufactured components.
Vietnam and Malaysia are also parties to the Comprehensive and Progressive Agreement for Trans Pacific Partnership and the Regional Comprehensive Economic Partnership, further deepening market access and investment flows.
Explore starting a business in Vietnam→
The data
Vietnam imports from Malaysia in January US$m
| January | December | MoM | YTD | |
| Total | 1,035.23 | 1,002.60 | 3.25% | 1,035.23 |
| computers | 307.58 | 320.71 | -4.10% | 307.58 |
| petroleum products | 171.82 | 67.34 | 155.17% | 171.82 |
| machine, equipment, tools and instruments | 124.52 | 117.44 | 6.03% | 124.52 |
| chemicals | 54.22 | 66.81 | -18.84% | 54.22 |
| animal, vegetable fats and oils | 50.63 | 58.59 | -13.60% | 50.63 |
| other base metals | 43.92 | 45.12 | -2.65% | 43.92 |
| other products | 36.18 | 76.98 | -53.01% | 36.18 |
| iron and steel | 30.08 | 24.04 | 25.11% | 30.08 |
| plastics | 26.27 | 29.98 | -12.36% | 26.27 |
| electric consumer products and parts thereof | 26.16 | 8.12 | 222.14% | 26.16 |
| chemical products | 20.52 | 24.67 | -16.85% | 20.52 |
| paper | 18.46 | 14.82 | 24.53% | 18.46 |
| animal fodders and animal fodder materials | 15.47 | 3.14 | 393.21% | 15.47 |
| liquefied petroleum gases (lpg) | 14.76 | 21.03 | -29.84% | 14.76 |
| fabrics | 10.47 | 10.98 | -4.58% | 10.47 |
| plastic products | 8.51 | 8.67 | -1.89% | 8.51 |
| insulated wires and cables | 8.29 | 11.36 | -27.04% | 8.29 |
| other edible food preparations | 7.96 | 8.59 | -7.35% | 7.96 |
| pastries, sweets and cereal products | 6.16 | 8.03 | -23.27% | 6.16 |
| glass and glassware | 5.30 | 6.25 | -15.30% | 5.30 |
| yarn | 5.07 | 6.71 | -24.37% | 5.07 |
| iron and steel products | 4.84 | 4.80 | 0.88% | 4.84 |
| ores and other minerals product | 4.84 | 0.56 | 761.72% | 4.84 |
| other petroleum products | 4.72 | 5.79 | -18.47% | 4.72 |
| rubber products | 4.44 | 4.12 | 7.60% | 4.44 |
| milk and milk products | 4.00 | 5.03 | -20.39% | 4.00 |
| pharmaceutical products | 2.59 | 2.23 | 16.12% | 2.59 |
| other base metal products | 2.37 | 2.54 | -6.60% | 2.37 |
| fishery products | 2.26 | 2.12 | 6.46% | 2.26 |
| wood and wooden products | 2.21 | 1.44 | 53.20% | 2.21 |
| textile and footwear materials | 2.15 | 2.21 | -3.09% | 2.15 |
| parts and accessories of motor vehicles | 2.02 | 2.74 | -26.10% | 2.02 |
| rubber | 1.72 | 1.07 | 60.70% | 1.72 |
| insecticides, rodenticides and materials | 1.67 | 2.75 | -39.50% | 1.67 |
| paper products | 1.31 | 1.36 | -3.66% | 1.31 |
| essential oils and resinoids; perfumery, cosmetic or toilet preparations | 1.09 | 1.50 | -26.98% | 1.09 |
| fruits and vegetables | 0.37 | 0.35 | 4.95% | 0.37 |
| tobacco materials | 0.17 | 0.70 | -75.94% | 0.17 |
| fertilizers | 0.09 | 2.41 | -96.47% | 0.09 |
| other means of transportation, parts and accessories thereof | 0.03 | 19.42 | -99.85% | 0.03 |
| coal | 0.00 | 0.05 | -100.00% | 0.00 |
Vietnam trade with Malaysia year to date US$m
| January | December | MoM | YTD | |
| Imports | 1,035.23 | 1,002.60 | 3.25% | 1,035.23 |
| Exports | 539.02 | 511.68 | 5.34% | 539.02 |
| Total | 1,574.25 | 1,514.28 | 3.96% | 1,574.25 |
| Balance | -496.21 | -490.92 | 1.08% | -496.21 |