
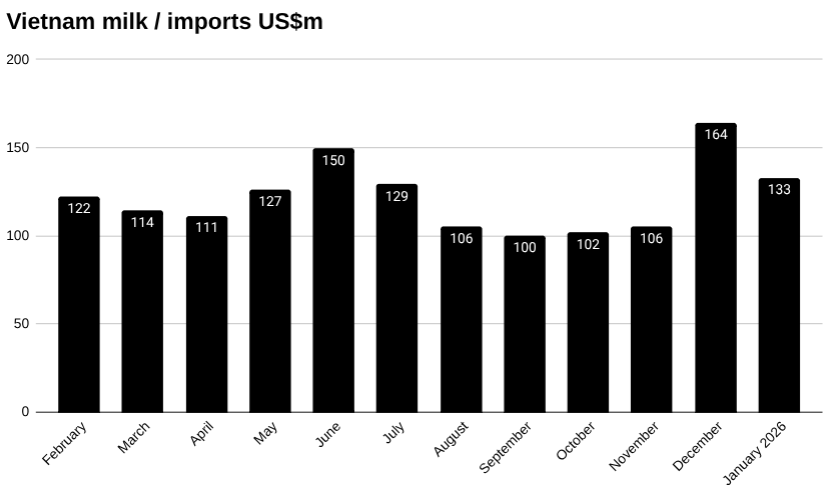
Vietnam imported milk and milk products to the tune of US$133 million in January, down from US$164 million in December, a change of -18.97 percent, according to preliminary data from Vietnam’s General Department of Customs.
Year to date, Vietnam had imported US$133 million worth of milk and milk products by the end of January.
New Zealand accounted for US$51 million worth of Vietnam’s milk and milk products imports in January. This was down from US$61 million in milk and milk products imports in December, a change of 17.32 percent. Year to date, New Zealand has shipped US$51 million worth of milk and milk products to Vietnam.
After New Zealand, the USA making up US$12 million worth of Vietnam’s milk and milk products imports in January. This was down from US$16 million in milk and milk products imports in December, a change of 28.84 percent. Year to date, the USA has shipped US$12 million worth of milk and milk products to Vietnam.
Next was Germany contributing US$10 million worth of Vietnam’s milk and milk products imports in January. This was up from US$6 million in milk and milk products imports in December, a change of 57.20 percent. Year to date, Germany has shipped US$10 million worth of milk and milk products to Vietnam.
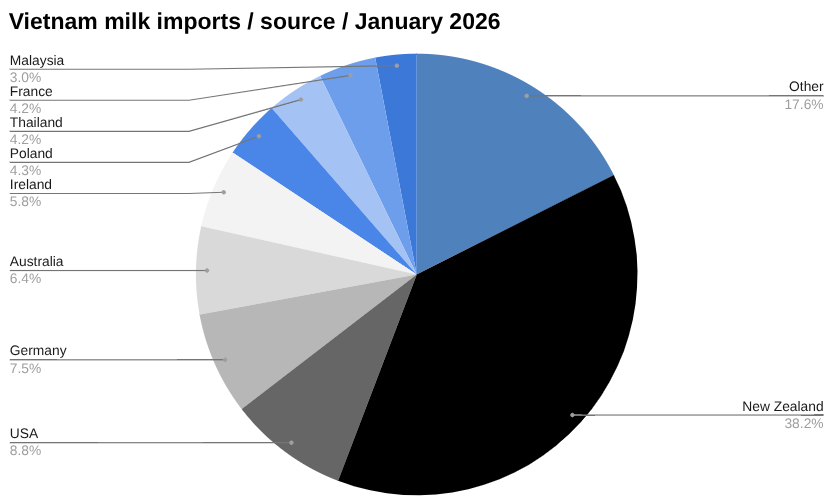
Following Germany was Australia representing US$9 million worth of Vietnam’s milk and milk products imports in January. This was down from US$19 million in milk and milk products imports in December, a change of 54.24 percent. Year to date, Australia has shipped US$9 million worth of milk and milk products to Vietnam.
Rounding out the top five was Ireland constituting US$8 million worth of Vietnam’s milk and milk products imports in January. This was up from US$7 million in milk and milk products imports in December, a change of 13.19 percent. Year to date, Ireland has shipped US$8 million worth of milk and milk products to Vietnam.
Learn more about accessing Vietnam’s consumer market→
Powdered milk production
Vietnam produced 13.59 thousand tons of powdered milk in January, up 1.80 percent from 13.35 thousand tons in December, according to the latest data from the National Statistics Office. Read the full report→

Fresh milk production
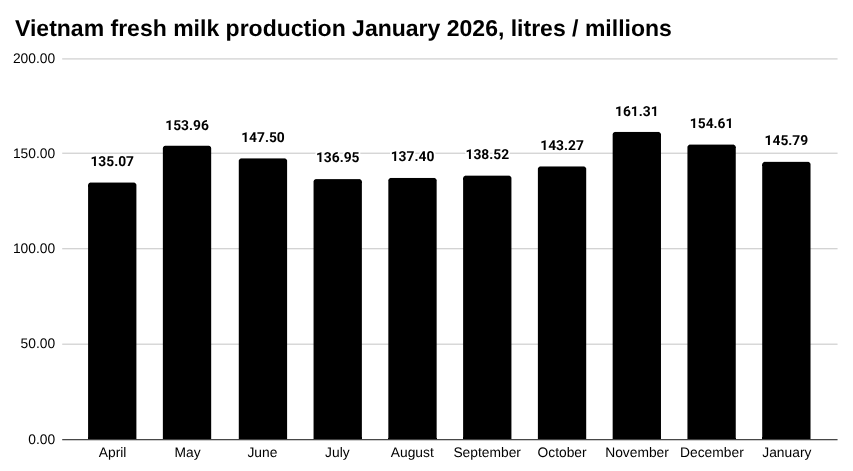
Vietnam produced 145.79 million litres of fresh milk in January, down 5.71 percent from 154.61 million litres in December, according to the latest data from the National Statistics Office.
Year-to-date output reached 145.79 million litres by the end of January. Read the full report→
Listed milk and milk products companies
Key milk and milk products firms listed on the Vietnam stock exchange include:
Moc Chau Milk JSC
Moc Chau Milk JSC (MCM) produces and distributes fresh milk, yoghurt, and dairy products sourced from Moc Chau Plateau.
MCM closed at VND 26,500 on Wednesday, down 0.3 percent with 344,000 shares traded, worth VND 912 million.
Foreign ownership in MCM is currently capped at 100.0 percent, with current foreign ownership sitting at 0.0 percent.
Vietnam Dairy Products JSC
Vietnam Dairy Products JSC (VNM) manufactures and distributes milk and dairy products under the Vinamilk brand.
VNM closed at VND 64,900 on Wednesday, up 1.5 percent with 133,825,000 shares traded, worth VND 844,252 million.
Foreign ownership in VNM is currently capped at 100.0 percent, with current foreign ownership sitting at 48.8 percent.
Explore opening a trading account in Vietnam→
Vietnam’s milk industry
Vietnam’s milk and dairy products industry has expanded rapidly over the past two decades, driven by rising incomes, urbanisation and changing consumer diets.
Domestic production is led by companies such as Vinamilk and TH True Milk, while multinational brands also compete in segments such as infant formula and processed dairy products.
Despite strong growth, Vietnam remains partly reliant on imported milk powder and dairy ingredients to meet domestic demand.
Major suppliers include New Zealand, Australia, and the United States, reflecting a limited domestic raw milk supply.
Find out about starting a business in Vietnam→
The data
Vietnam imports of milk and milk products in January, US$m
| January | December | MoM | YTD | |
| Total | 132.94 | 164.08 | -18.97% | 132.94 |
| Other | 9.34 | 11.90 | -21.51% | 9.34 |
| New Zealand | 50.83 | 61.49 | -17.32% | 50.83 |
| USA | 11.65 | 16.37 | -28.84% | 11.65 |
| Germany | 10.00 | 6.36 | 57.20% | 10.00 |
| Australia | 8.53 | 18.64 | -54.24% | 8.53 |
| Ireland | 7.72 | 6.82 | 13.19% | 7.72 |
| Poland | 5.69 | 5.53 | 2.92% | 5.69 |
| Thailand | 5.58 | 5.24 | 6.49% | 5.58 |
| France | 5.58 | 6.28 | -11.23% | 5.58 |
| Malaysia | 4.00 | 5.03 | -20.39% | 4.00 |
| Singapore | 3.49 | 3.73 | -6.51% | 3.49 |
| Netherlands | 3.25 | 2.73 | 18.96% | 3.25 |
| Japan | 1.83 | 3.97 | -54.04% | 1.83 |
| Lithuania | 1.60 | 1.40 | 13.83% | 1.60 |
| Switzerland | 1.10 | 1.32 | -16.56% | 1.10 |
| South Korea | 1.06 | 1.98 | -46.49% | 1.06 |
| Spain | 1.00 | 1.54 | -35.31% | 1.00 |
| Belgium | 0.32 | 3.28 | -90.17% | 0.32 |
| Denmark | 0.32 | 0.44 | -28.89% | 0.32 |
| Philippines | 0.05 | 0.00 | 0.00% | 0.05 |