
Vietnam imported motor vehicles to the tune of US$359 million in February, down from US$385 million in January, a change of -6.84 percent, according to preliminary data from Vietnam’s General Department of Customs.
Year to date, Vietnam imported US$746 million worth of motor vehicles by the end of February. 
China accounted for US$123 million of Vietnam’s motor vehicle imports in February, down from US$222 million in January, a decline of 44.70 percent. Year to date, imports from China reached US$344 million.
Indonesia followed with US$107 million in February, up from US$57 million in January, an increase of 87.18 percent. Year to date, imports from Indonesia totalled US$165 million.
Thailand recorded US$98 million in February, up from US$62 million in January, an increase of 57.52 percent. Year to date, imports from Thailand reached US$160 million.
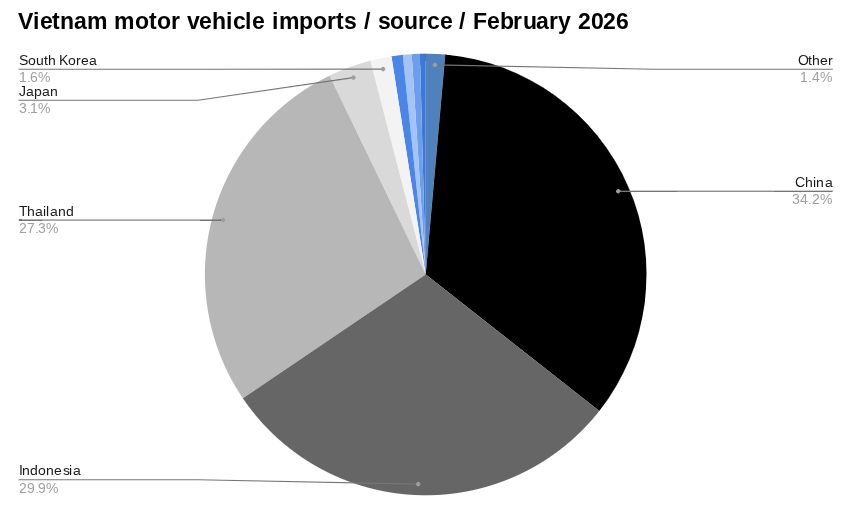
Japan accounted for US$11 million in February, down from US$14 million in January, a decrease of 17.36 percent. Year to date, imports from Japan totalled US$25 million.
South Korea rounded out the top five with US$6 million in February, up from an unspecified level in January, a change of 1126.59 percent. Year to date, imports from South Korea reached US$6 million.
Learn more about accessing Vietnam’s consumer market→
Listed automotive companies
Key motor vehicle firms listed on the Vietnam stock exchange include:
Dry Cell and Storage Battery JSC (PAC)
Dry Cell and Storage Battery JSC (PAC) produces automotive and industrial batteries under the PINACO brand. (PAC)
In February, PAC shares moved from 22.80 to 22.95, a change of 0.15 (0.01 percent). Foreign ownership moved from 264,283.31 to 264,172.80, a change of -110.51 (0.00 percent).
Vingroup JSC (VIC)
Vingroup JSC (VIC) is Vietnam’s largest private conglomerate, operating in real estate, automotive (VinFast), healthcare, and education. (VIC)
In February, VIC shares moved from 140.50 to 172.00, a change of 31.50 (0.22 percent). Foreign ownership moved from 34,801,363.73 to 34,963,909.05, a change of 162,545.32 (0.00 percent).
Explore opening a trading account in Vietnam→
Vietnam automotive news
Recent developments include:
Car sales in February
Total car sales in Vietnam reached 15,665 units in February compared to 29,774 units in Jan 26. Year-to-date, the VAMA has recorded 45,439 Total car sales. This is compared to 32,857 units over the same period in 2025. Read more→
Automotive partnership VN-CN
Vietnam’s Kim Long Motor and China’s AOJ Suzhou signed a strategic cooperation agreement in Ho Chi Minh City on 14 February to jointly develop commercial vehicles and passenger platforms.
AOJ Suzhou will provide product planning, design, technical development, supply chain integration, testing and mass production support, while Kim Long Motor contributes manufacturing capacity and distribution networks in Vietnam.
The partnership targets buses, vans, trucks and all aluminium passenger vehicle platforms. Read more→
VinFast’s 2025 Financial Performance: Key Takeaways
As a cornerstone of Vingroup’s ecosystem, which spans multiple industries across Vietnam and employs thousands, VinFast’s performance carries wide-reaching implications. Here’s what that looked like at the end of 2025. Read more→
See the latest Vietnam news headlines→
Vietnam’s automotive industry
Vietnam’s automotive industry has grown rapidly, driven by rising incomes, urbanisation and expanding domestic demand for passenger and commercial vehicles.
The market is led by a mix of foreign assemblers and domestic players, with production largely focused on assembly and supported by government incentives to increase localisation.
The sector is shifting toward electric vehicles and greener transport, with domestic manufacturers investing in electrification and new production capacity.
At the same time, the industry faces challenges including low localisation rates in some segments, reliance on imported components and increasing competition from regional imports.
Find out about starting a business in Vietnam→
The data
Vietnam imports of motor vehicles in February, US$m
| February | January | MoM | YTD | |
| Total | 358.85 | 385.20 | -6.84% | 745.66 |
| Other | 4.12 | 14.62 | -71.80% | 18.74 |
| China | 122.74 | 221.93 | -44.70% | 344.19 |
| Indonesia | 107.36 | 57.36 | 87.18% | 164.76 |
| Thailand | 97.98 | 62.20 | 57.52% | 160.19 |
| Japan | 11.25 | 13.62 | -17.36% | 24.87 |
| South Korea | 5.58 | 0.45 | 1126.59% | 6.03 |
| Russia | 2.95 | 4.63 | -36.42% | 9.62 |
| UK | 2.32 | 0.94 | 148.47% | 3.26 |
| Germany | 2.14 | 7.18 | -70.26% | 9.32 |
| USA | 1.49 | 0.27 | 456.02% | 1.76 |
| Austria | 0.68 | 1.25 | -45.75% | 1.93 |
| India | 0.24 | 0.66 | -64.17% | 0.89 |
| France | 0.00 | 0.08 | -100.00% | 0.08 |