
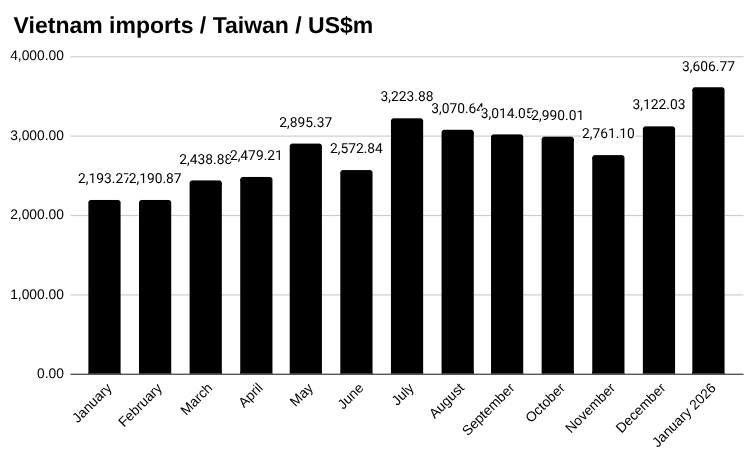
In January, Vietnam imported US$3,606.77 million worth of goods from Taiwan, up from US$3,122.03 million in December, a change of 15.53 percent, according to preliminary data from Vietnam’s General Department of Customs.
So far this year, Vietnam has imported US$3,607 million worth of goods from Taiwan.
Vietnam imported US$2,753.44 million worth of computers from Taiwan in January. This was up from US$2,262.26 million in December, a change of 21.71 percent.
Vietnam imported US$159.22 million worth of machines, equipment, tools and instruments from Taiwan in January. This was up from US$149.62 million in December, a change of 6.41 percent.
Vietnam imported US$138.69 million worth of fabrics from Taiwan in January. This was up from US$135.48 million in December, a change of 2.37 percent.
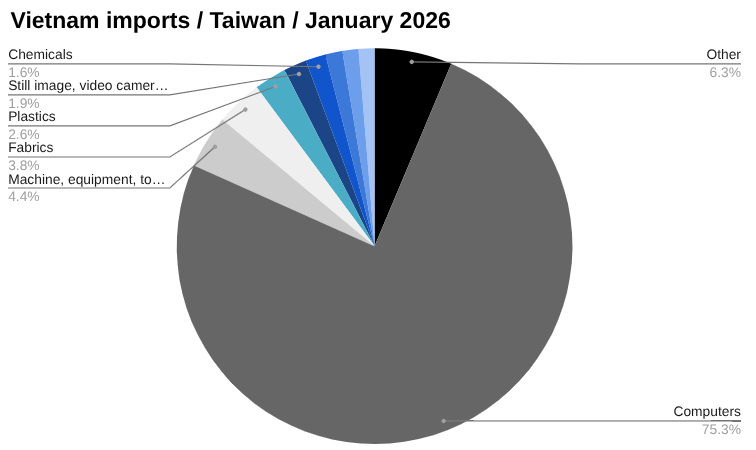
Vietnam imported US$96.29 million worth of plastics from Taiwan in January. This was up from US$91.49 million in December, a change of 5.25 percent.
Vietnam imported US$68.68 million worth of still image, video cameras and parts thereof from Taiwan in January. This was up from US$63.33 million in December, a change of 8.45 percent.
Learn more about manufacturing in Vietnam→
Vietnam trade with Taiwan
In January, Vietnam imported goods worth US$3,606.77 million from Taiwan and exported US$534.55 million, bringing total trade to US$4,141.32 million and resulting in a trade deficit of US$3,072.22 million.
Two-way trade so far this year between Vietnam and Taiwan has reached US$4,141.32 million, with Vietnam importing US$3,606.77 million worth of goods and exporting US$534.55 million.
Discover more about trade in Vietnam→
Vietnam-Taiwan trade relations
Vietnam and Taiwan have developed strong economic ties since the early 1990s, following Vietnam’s Doi Moi reforms and Taiwan’s outward investment push into Southeast Asia.
While there is no formal free trade agreement due to diplomatic constraints, trade and investment are governed through economic cooperation frameworks, investment protection arrangements and double taxation avoidance agreements.
Taiwan is among Vietnam’s largest foreign investors, particularly in manufacturing sectors such as electronics, textiles, footwear materials and machinery.
Bilateral trade has expanded steadily, supported by supply chain integration and Taiwan’s role as both a technology partner and a key source of intermediate industrial inputs for Vietnam’s export sector.
Explore starting a business in Vietnam→
The data
Vietnam trade with Taiwan year to date US$m
| January | December | MoM | YTD | |
| Imports | 3,606.77 | 3,122.03 | 15.53% | 3,606.77 |
| Exports | 534.55 | 608.76 | -12.19% | 534.55 |
| Total | 4,141.32 | 3,730.78 | 11.00% | 4,141.32 |
| Balance | -3,072.22 | -2,513.27 | 22.24% | -3,072.22 |
Vietnam imports from Taiwan in January US$m
| January | December | MoM | YTD | |
| Total | 3,606.77 | 3,122.03 | 15.53% | 3,606.77 |
| Computers | 2,753.44 | 2,262.26 | 21.71% | 2,753.44 |
| Machine, equipment, tools and instruments | 159.22 | 149.62 | 6.41% | 159.22 |
| Fabrics | 138.69 | 135.48 | 2.37% | 138.69 |
| Plastics | 96.29 | 91.49 | 5.25% | 96.29 |
| Still image, video cameras and parts thereof | 68.68 | 63.33 | 8.45% | 68.68 |
| Chemicals | 60.28 | 80.77 | -25.37% | 60.28 |
| Iron and steel | 50.83 | 62.53 | -18.71% | 50.83 |
| Chemical products | 47.82 | 43.49 | 9.95% | 47.82 |
| Other products | 47.44 | 46.73 | 1.52% | 47.44 |
| Plastic products | 32.27 | 32.52 | -0.77% | 32.27 |
| textile and footwear materials | 30.05 | 31.23 | -3.78% | 30.05 |
| Other base metals | 24.14 | 23.36 | 3.31% | 24.14 |
| Iron and steel products | 16.73 | 16.56 | 1.04% | 16.73 |
| Yarn | 15.16 | 16.99 | -10.78% | 15.16 |
| Other petroleum products | 10.69 | 9.46 | 12.99% | 10.69 |
| Rubber | 9.99 | 11.30 | -11.54% | 9.99 |
| Fishery products | 8.29 | 4.06 | 104.17% | 8.29 |
| Other base metal products | 6.57 | 6.10 | 7.68% | 6.57 |
| Paper | 5.08 | 6.72 | -24.44% | 5.08 |
| Other edible food preparations | 4.02 | 2.07 | 94.00% | 4.02 |
| Insulated wires and cables | 3.44 | 3.49 | -1.37% | 3.44 |
| Animal fodders and animal fodder materials | 3.00 | 3.26 | -7.94% | 3.00 |
| Fertilizers | 2.69 | 1.46 | 84.48% | 2.69 |
| Rubber products | 2.25 | 3.07 | -26.51% | 2.25 |
| Paper products | 1.79 | 1.54 | 16.65% | 1.79 |
| Electric consumer products and parts thereof | 1.21 | 0.81 | 50.53% | 1.21 |
| Glass and glassware | 1.17 | 1.37 | -14.97% | 1.17 |
| Ores and other minerals product | 1.13 | 1.42 | -20.45% | 1.13 |
| Ferrous waste and scrap | 0.97 | 0.46 | 110.95% | 0.97 |
| Pharmaceutical products | 0.69 | 2.98 | -77.02% | 0.69 |
| Telephones, mobile phones and parts thereof | 0.64 | 3.16 | -79.75% | 0.64 |
| Essential oils and resinoids; perfumery, cosmetic or toilet preparations | 0.56 | 0.62 | -8.81% | 0.56 |
| Insecticides, rodenticides and materials | 0.53 | 0.87 | -39.52% | 0.53 |
| other means of transportation, parts and accessories thereof | 0.38 | 0.26 | 44.50% | 0.38 |
| Cotton | 0.27 | 0.33 | -19.74% | 0.27 |
| Precious stones, precious metal and articles | 0.23 | 0.70 | -67.68% | 0.23 |
| Wood and wooden products | 0.14 | 0.14 | -4.40% | 0.14 |
| Liquefied petroleum gases (LPG) | 0.00 | 0.00 | 0.00% | 0.00 |