
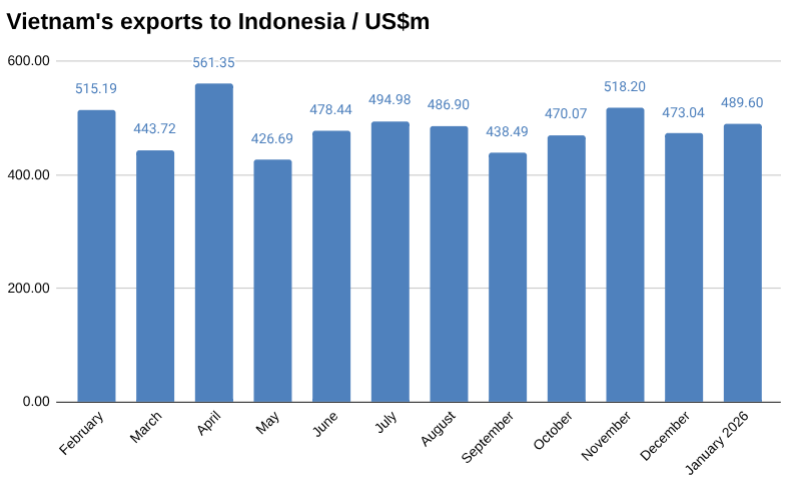
In January, Vietnam exported US$490 million worth of goods to Indonesia, up 3.50 percent over December, according to preliminary data from Vietnam’s General Department of Customs.
So far this year, Vietnam has exported US$490 million worth of goods to Indonesia.
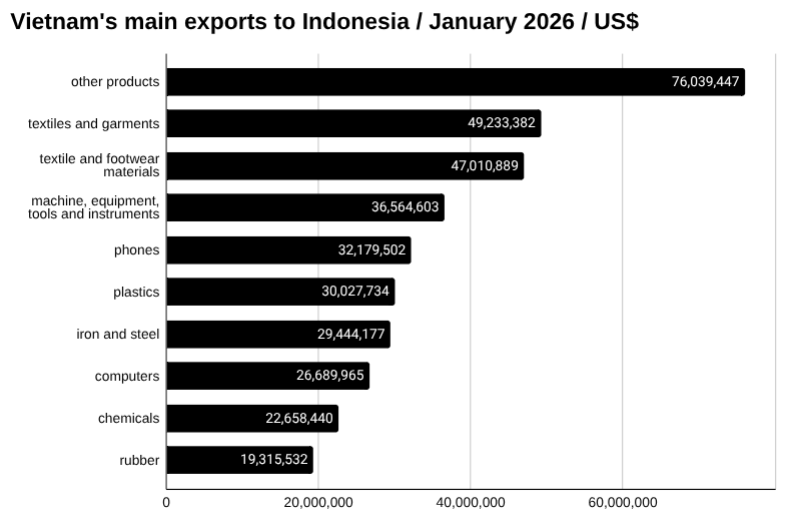
It also exported US$49.23 million worth of textiles and garments to Indonesia in January. This was up from US$47.61 million in December, a change of 3.41 percent.
Adding to that, Vietnam exported US$47.01 million worth of textile and footwear materials to Indonesia in January. This was up from US$37.08 million in December, a change of 26.80 percent.
It also exported US$36.56 million worth of machines, equipment, tools and instruments to Indonesia in January. This was up from US$36.20 million in December, a change of 1.01 percent.
Vietnam also exported US$32.18 million worth of phones to Indonesia in January. This was up from US$15.98 million in December, a change of 101.38 percent.
Learn more about manufacturing in Vietnam→
Vietnam’s trade with Indonesia
In January, Vietnam imported US$967.74 million worth of goods from Indonesia and exported US$489.60 million to Indonesia, for total trade worth US$1,457.34 million, and leaving a trade deficit of US$478.14 million.
Two-way trade so far this year between Vietnam and Indonesia has reached US$1,457 million, with Vietnam importing US$968 million worth of goods and exporting US$490 million worth of goods.
Discover more about trade in Vietnam→
Vietnam – Indonesia latest developments
Recent developments in trade and investment between the two countries include:
Trade remedies on Indonesian / Malaysian glass
The Ministry of Industry and Trade, on January 30, 2026, imposed provisional anti-dumping duties on certain clear float glass imported from Indonesia and Malaysia.
The provisional duties range from 15.17 percent to 63.39 percent depending on the producer and exporter, following a complaint filed in May 2025 by domestic manufacturers.
Preliminary findings showed dumped imports caused significant injury to domestic producers, with import volumes rising more than 61.82 percent after the investigation was launched.
VinFast Indonesia enters the infrastructure sector
VinFast Indonesia has signed a strategic cooperation agreement with Subang Regency and toll road operator PT Lintas Marga Sedaya to develop an interchange on the Cipali Expressway in Indonesia.
VinFast will act as the sole strategic investor, fully funding planning, permitting, construction, and related costs for the Manyingsal interchange at Km 115+500, the article says.
The project has received in-principle approval from Indonesia’s Ministry of Public Works, with a maximum completion timeline of three years after licensing.”
See the latest Vietnam news headlines→
Vietnam – Indonesia trade relations
Vietnam and Indonesia established diplomatic relations in 1955, forming one of the earliest bilateral ties in Southeast Asia.
Economic engagement expanded steadily after both countries embarked on market-oriented reforms, with trade rising alongside deeper regional integration through the Association of Southeast Asian Nations.
The relationship was elevated to a Strategic Partnership in 2013, creating structured cooperation across trade, investment, energy, fisheries and defence.
Bilateral trade has been further supported by the ASEAN Trade in Goods Agreement and the Regional Comprehensive Economic Partnership, which provide tariff reductions and common trade rules across the region.
Explore starting a business in Vietnam→
The data
Vietnam trade with Indonesia year to date January US$m
| January | December | Change | YTD | |
| Imports | 967.74 | 1,159.43 | -16.53% | 967.74 |
| Exports | 489.60 | 473.04 | 3.50% | 489.60 |
| Total | 1,457.34 | 1,632.47 | -10.73% | 1,457.34 |
| Balance | -478.14 | -686.39 | -30.34% | -478.14 |
Vietnam exports to Indonesia in January US$m
| January | December | Change | YTD | |
| Total | 489.60 | 473.04 | 3.50% | 489.60 |
| other products | 76.04 | 64.71 | 17.51% | 76.04 |
| textiles and garments | 49.23 | 47.61 | 3.41% | 49.23 |
| textile and footwear materials | 47.01 | 37.08 | 26.80% | 47.01 |
| machine, equipment, tools and instruments | 36.56 | 36.20 | 1.01% | 36.56 |
| phones | 32.18 | 15.98 | 101.38% | 32.18 |
| plastics | 30.03 | 22.88 | 31.22% | 30.03 |
| iron and steel | 29.44 | 35.32 | -16.64% | 29.44 |
| computers | 26.69 | 17.74 | 50.45% | 26.69 |
| chemicals | 22.66 | 12.86 | 76.20% | 22.66 |
| rubber | 19.32 | 12.51 | 54.35% | 19.32 |
| other means of transportation, parts and accessories thereof | 18.77 | 47.47 | -60.45% | 18.77 |
| paper and paper products | 16.11 | 12.47 | 29.20% | 16.11 |
| plastic products | 14.87 | 12.98 | 14.60% | 14.87 |
| coffee | 12.80 | 14.48 | -11.61% | 12.80 |
| chemical products | 12.49 | 23.76 | -47.43% | 12.49 |
| footwear | 10.98 | 13.90 | -20.99% | 10.98 |
| yarn | 9.32 | 7.14 | 30.58% | 9.32 |
| pastry, sweets and cereals products | 3.51 | 2.11 | 65.86% | 3.51 |
| other base metals and other base metal products | 3.22 | 3.05 | 5.44% | 3.22 |
| rubber products | 3.09 | 1.92 | 60.66% | 3.09 |
| coal | 2.90 | 9.55 | -69.59% | 2.90 |
| insulated wires and cables | 2.53 | 2.84 | -11.02% | 2.53 |
| tyre cord fabrics and other fabrics for technical uses | 2.41 | 2.47 | -2.46% | 2.41 |
| iron and steel products | 2.03 | 4.12 | -50.68% | 2.03 |
| fruits and vegetables | 1.67 | 2.10 | -20.88% | 1.67 |
| animal fodders and animal fodder materials | 0.96 | 0.63 | 51.98% | 0.96 |
| tea | 0.78 | 0.67 | 16.62% | 0.78 |
| ceramic products | 0.64 | 0.20 | 225.63% | 0.64 |
| rice | 0.60 | 3.04 | -80.19% | 0.60 |
| fishery products | 0.22 | 0.71 | -68.81% | 0.22 |
| petroleum products | 0.21 | 0.00 | 0.00% | 0.21 |
| ores and other minerals product | 0.20 | 4.45 | -95.61% | 0.20 |
| non-wood furniture | 0.12 | 0.08 | 44.87% | 0.12 |