
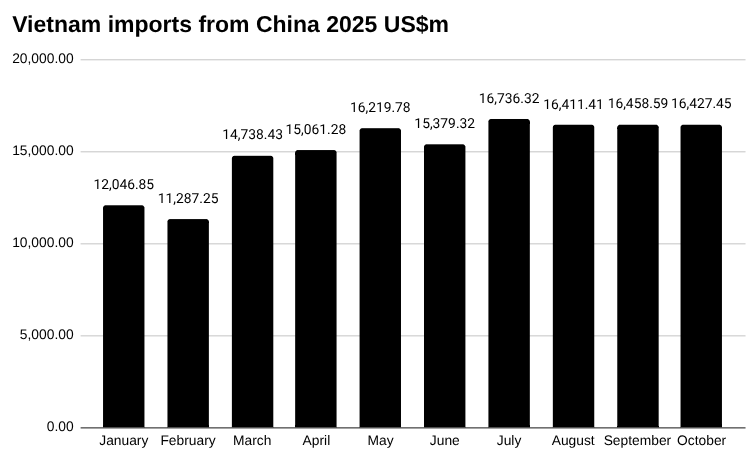
In November, Vietnam imported US$16.5 billion worth of goods from China, up from US$16.4 billion in October, a change of 0.35 percent, according to preliminary data from Vietnam’s General Department of Customs.
So far this year, Vietnam has imported US$167,504 million worth of goods from China.
Vietnam imported US$4780.74 million worth of computers, electrical products, spare-parts and components thereof from China in November. This was up from US$4,550.36 million in October, a change of 5.06 percent.
Vietnam imported US$3337.41 million worth of machines, equipment, tools and instruments from China in November. This was up from US$3,216.39 million in October, a change of 3.76 percent.
Vietnam imported US$852.80 million worth of other products from China in November. This was up from US$795.29 million in October, a change of 7.23 percent.
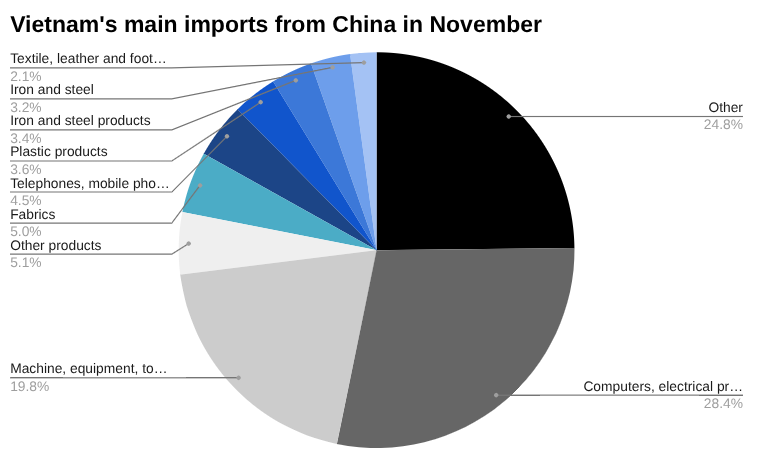
Vietnam imported US$844.80 million worth of fabrics from China in November. This was down from US$873.67 million in October, a change of -3.31 percent.
Vietnam imported US$759.28 million worth of telephones, mobile phones and parts thereof from China in November. This was down from US$1,080.48 million in October, a change of -29.73 percent.
Learn more about manufacturing in Vietnam→
Vietnam imports from China in November US$millions
| November | October | MoM | YTD | |
| Total | 16,485.08 | 16,427.45 | 0.35% | 167,504.07 |
| Computers, electrical products, spare-parts and components thereof | 4,780.74 | 4,550.36 | 5.06% | 47,826.03 |
| Machine, equipment, tools and instruments | 3,337.41 | 3,216.39 | 3.76% | 34,749.54 |
| Other products | 852.80 | 795.29 | 7.23% | 8,002.83 |
| Fabrics | 844.80 | 873.67 | -3.31% | 9,399.99 |
| Telephones, mobile phones and parts thereof | 759.28 | 1,080.48 | -29.73% | 8,920.10 |
| Plastic products | 612.67 | 600.56 | 2.02% | 6,157.37 |
| Iron and steel products | 569.36 | 533.91 | 6.64% | 5,401.47 |
| Iron and steel | 545.30 | 601.16 | -9.29% | 5,236.79 |
| Textile, leather and footwear materials and auxiliaries | 360.20 | 358.94 | 0.35% | 3,934.20 |
| Other base metal products | 356.45 | 358.50 | -0.57% | 3,711.02 |
| Plastics | 329.11 | 329.36 | -0.08% | 3,513.37 |
| Other base metals | 314.05 | 360.42 | -12.87% | 3,311.61 |
| Chemical products | 309.98 | 290.76 | 6.61% | 3,052.73 |
| Chemicals | 281.22 | 289.45 | -2.84% | 3,212.93 |
| Parts and accessories of motor vehicles | 269.05 | 241.25 | 11.52% | 2,108.08 |
| Insulated wires and cables | 257.50 | 253.19 | 1.71% | 2,817.74 |
| Yarn | 162.27 | 164.98 | -1.64% | 1,753.01 |
| Motor vehicles | 157.29 | 156.99 | 0.19% | 1,447.08 |
| Still image, video cameras and parts thereof | 131.63 | 131.16 | 0.36% | 1,288.33 |
| Fruits and vegetables | 121.55 | 104.22 | 16.63% | 894.45 |
| Petroleum products | 117.73 | 72.21 | 63.05% | 908.98 |
| Electric consumer products and parts thereof | 114.03 | 90.29 | 26.29% | 952.40 |
| Wood and wooden products | 104.95 | 100.15 | 4.80% | 1,149.52 |
| Glass and glassware | 93.89 | 74.89 | 25.36% | 853.22 |
| Precious stones, precious metal and articles | 85.37 | 145.87 | -41.48% | 388.81 |
| Paper products | 84.24 | 85.30 | -1.24% | 889.86 |
| Paper | 83.62 | 77.33 | 8.13% | 859.83 |
| Fertilizers | 77.75 | 113.39 | -31.43% | 998.98 |
| Rubber products | 56.93 | 56.42 | 0.90% | 587.93 |
| Rubber | 42.78 | 36.43 | 17.41% | 431.58 |
| Animal fodders and animal fodder materials | 38.87 | 31.76 | 22.37% | 329.43 |
| Insecticides, rodenticides and materials | 34.26 | 26.96 | 27.10% | 387.68 |
| Pharmaceutical materials | 32.57 | 32.66 | -0.27% | 336.73 |
| Fishery products | 26.71 | 24.73 | 8.01% | 252.73 |
| Essential oils and resinoids; perfumery, cosmetic or toilet preparations | 25.58 | 19.15 | 33.57% | 194.07 |
| Other means of transportation, parts and accessories thereof | 24.14 | 46.66 | -48.26% | 226.34 |
| Pastries, sweets and cereal products | 20.30 | 19.04 | 6.64% | 147.92 |
| Other petroleum products | 15.57 | 13.95 | 11.67% | 232.47 |
| Other edible food preparations | 13.63 | 14.09 | -3.30% | 134.09 |
| Liquefied petroleum gases (LPG) | 12.73 | 15.84 | -19.64% | 180.17 |
| Ores and other minerals product | 10.18 | 9.42 | 8.07% | 103.22 |
| Pharmaceutical products | 6.97 | 5.65 | 23.45% | 55.11 |
| Tobacco materials | 5.32 | 9.18 | -42.02% | 52.69 |
| Coal | 2.26 | 12.92 | -82.50% | 78.82 |
| Animal, vegetable fats and oils | 2.04 | 2.15 | -4.96% | 31.44 |
| Cotton | 0.00 | 0.00 | 0.00% | 1.39 |
Vietnam trade with China
In November, Vietnam imported US$16,485.08 million worth of goods from China and exported US$6190.48 million, for total trade worth US$22,675.56 million, and leaving a trade deficit of US$10,294.60 million.
Two-way trade so far this year between Vietnam and China has reached US$230,668 million, with Vietnam importing US$167,504 million worth of goods and exporting US$63,164 million worth of goods.
Discover more about trade in Vietnam→
Vietnam trade with China year to date November US$millions
| November | October | Change | YTD | |
| Imports | 16,485.08 | 16,427.45 | 0.35% | 167,504.07 |
| Exports | 6,190.48 | 7,256.20 | -14.69% | 63,163.60 |
| Total | 22,675.56 | 23,683.65 | -4.26% | 230,667.67 |
| Balance | -10,294.60 | -9,171.25 | 12.25% | -104,340.48 |
Vietnam-China trade relations
Vietnam and China maintain an extensive set of trade agreements that facilitate the flow of goods, services and investment across their shared border.
Bilateral mechanisms and sectoral cooperation frameworks complement wider commitments under ASEAN–China arrangements, supporting supply-chain integration and cross-border commerce.
The two countries have a long history of economic engagement shaped by proximity, historic trading routes and evolving regional frameworks.
Their trade relationship has expanded through diplomatic normalisation, regular high-level dialogues and agreements aimed at easing customs procedures and promoting stable economic ties.