
Vietnam’s imports from South Korea increased 2.2 percent month-on-month to US$5.42 billion in September 2025, according to Vietnam’s General Department of Customs.
Year-to-date imports reached US$44.45 billion, underscoring South Korea’s role as one of Vietnam’s top suppliers of industrial inputs and technology goods.

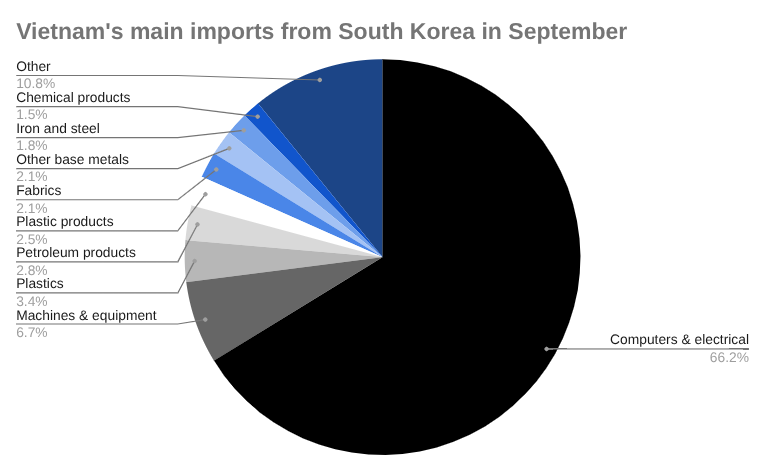
Electronics continued to dominate, with computers, electrical products, spare parts, and components climbing 4.34 percent to US$3.59 billion.
Imports of machines, equipment, tools, and instruments rose 1.15 percent to US$365.2 million, while fabric imports jumped 25.38 percent to US$114.9 million.
Conversely, petroleum products and iron and steel declined 11.04 percent and 37.56 percent respectively, reflecting softer demand from energy and construction sectors.
Notable smaller categories saw sharp swings: motor vehicle imports surged 447.04 percent to US$8.26 million, while fertilizer imports jumped nearly 289.10 percent.
Meanwhile, LPG and ores and minerals contracted 20.42 percent and 29.02 percent, respectively.
Vietnam—South Korea bilateral trade 2025
The sustained import flow from South Korea highlights deep supply chain integration between the two economies, particularly in electronics, machinery, and materials for Vietnam’s export manufacturing industries.
Vietnam’s trade with South Korea reached US$7.87 billion in September 2025, slightly down 0.78 percent from August.
Exports fell 6.81 percent to US$2.45 billion, while imports rose 2.2 percent to US$5.42 billion, widening Vietnam’s trade deficit with South Korea to US$2.97 billion for the month.
For the first nine months of 2025, total bilateral trade amounted to US$65.82 billion, with Vietnam running a cumulative deficit of US$23.07 billion.
Vietnam—South Korea balance of trade, September 2025 US$millions
| September | August | MoM | YTD | |
| Imports | 5,421.87 | 5,304.94 | 2.20% | 44,445.34 |
| Exports | 2,449.27 | 2,628.38 | -6.81% | 21,372.92 |
| Total | 7,871.14 | 7,933.32 | -0.78% | 65,818.25 |
| Balance (Vietnam) | -2,972.60 | -2,676.57 | 11.06% | -23,072.42 |
Vietnam and South Korea maintain one of the most dynamic trade relationships in Asia, underpinned by strong manufacturing and technology linkages.
South Korea is among Vietnam’s top three trading partners, supplying high-value goods such as electronics, machinery, semiconductors, and industrial materials.
In turn, Vietnam exports electronics, textiles, and agricultural products to South Korea, reflecting a complementary structure that supports both nations’ industrial strategies.
Since the Vietnam–Korea Free Trade Agreement took effect in 2015, bilateral trade has expanded rapidly, supported by substantial South Korean investment in Vietnam’s manufacturing and infrastructure sectors.
Major corporations like Samsung, LG, and Hyundai have helped integrate Vietnam into regional supply chains.
Despite Vietnam’s persistent trade deficit, the partnership continues to deepen through technology transfer, industrial cooperation, and emerging collaboration in green energy and digital transformation.
Learn more about starting a business in Vietnam →
Vietnam imports from South Korea in September 2025, US$millions
| September | August | MoM | YTD | |
| Total | 5,421.87 | 5,304.94 | 2.20% | 44,445.34 |
| Computers, electrical products, spare-parts and components thereof | 3,591.73 | 3,442.48 | 4.34% | 27,685.64 |
| Machine, equipment, tools and instruments | 365.16 | 361.00 | 1.15% | 3,455.88 |
| Plastics | 183.65 | 196.66 | -6.61% | 1,641.60 |
| Petroleum products | 153.92 | 173.03 | -11.04% | 1,453.41 |
| Plastic products | 133.15 | 125.31 | 6.26% | 1,122.39 |
| Fabrics | 114.90 | 91.64 | 25.38% | 1,041.96 |
| Other base metals | 112.90 | 124.55 | -9.35% | 1,101.26 |
| Iron and steel | 99.76 | 159.78 | -37.56% | 942.75 |
| Chemical products | 79.22 | 71.91 | 10.16% | 658.31 |
| Other products | 76.02 | 71.60 | 6.17% | 735.39 |
| Iron and steel products | 60.62 | 60.13 | 0.82% | 547.63 |
| Parts and accessories of motor vehicles | 59.56 | 62.62 | -4.90% | 674.22 |
| Chemicals | 42.87 | 36.43 | 17.68% | 325.87 |
| Insulated wires and cables | 38.20 | 33.15 | 15.22% | 322.69 |
| Telephones, mobile phones and parts thereof | 34.65 | 42.26 | -18.02% | 302.96 |
| Textile, leather and footwear materials | 31.14 | 26.91 | 15.72% | 320.79 |
| Rubber | 23.47 | 23.73 | -1.08% | 235.57 |
| Essential oils and resinoids; perfumery, cosmetic | 23.37 | 22.51 | 3.81% | 179.63 |
| Other base metal products | 21.20 | 20.69 | 2.42% | 177.90 |
| Paper | 21.11 | 23.71 | -10.98% | 197.31 |
| Other petroleum products | 17.74 | 34.69 | -48.87% | 236.20 |
| Pharmaceutical products | 13.70 | 12.52 | 9.40% | 98.28 |
| Precious stones, precious metal and articles | 12.31 | 11.55 | 6.52% | 94.35 |
| Other means of transportation, parts and accessories thereof | 11.05 | 0.55 | 1910.71% | 70.20 |
| Fertilizers | 10.48 | 2.69 | 289.10% | 71.99 |
| Rubber products | 9.12 | 9.44 | -3.39% | 84.53 |
| Motor vehicles | 8.26 | 1.51 | 447.04% | 21.67 |
| Yarn | 7.99 | 6.47 | 23.62% | 81.33 |
| Glass and glassware | 7.90 | 7.13 | 10.81% | 58.39 |
| Other edible food preparations | 6.62 | 5.59 | 18.33% | 57.40 |
| Fishery products | 6.38 | 4.40 | 44.94% | 65.31 |
| Electric consumer products and parts thereof | 6.09 | 4.92 | 23.76% | 49.27 |
| Pastries, sweets and cereal products | 5.65 | 4.33 | 30.45% | 40.90 |
| Animal fodders and animal fodder materials | 4.92 | 4.79 | 2.88% | 45.48 |
| Still image, video cameras and parts thereof | 4.42 | 1.73 | 155.92% | 25.45 |
| Fruits and vegetables | 4.13 | 3.40 | 21.57% | 38.06 |
| Paper products | 4.09 | 3.63 | 12.57% | 41.09 |
| Insecticides, rodenticides and materials | 3.17 | 4.39 | -27.69% | 64.01 |
| Ores and other minerals product | 2.84 | 4.00 | -29.02% | 15.19 |
| Liquefied petroleum gases (LPG) | 2.72 | 3.41 | -20.42% | 26.95 |
| Milk and milk products | 2.32 | 2.10 | 10.42% | 18.49 |
| Pharmaceutical materials | 1.22 | 0.02 | 5482.57% | 4.04 |
| Wood and wooden products | 1.19 | 0.56 | 114.02% | 6.17 |
| Animal, vegetable fats and oils | 0.74 | 0.57 | 29.22% | 5.42 |
| Cotton | 0.27 | 0.44 | -38.39% | 1.99 |