
Vietnam’s exports of computers, electrical products, and spare parts rose 4.31 percent month-on-month in September 2025 to US$10.59 billion, according to Vietnam’s General Department of Customs.
Year-to-date exports reached US$77.49 billion, underscoring the sector’s strong position as one of Vietnam’s top export categories.
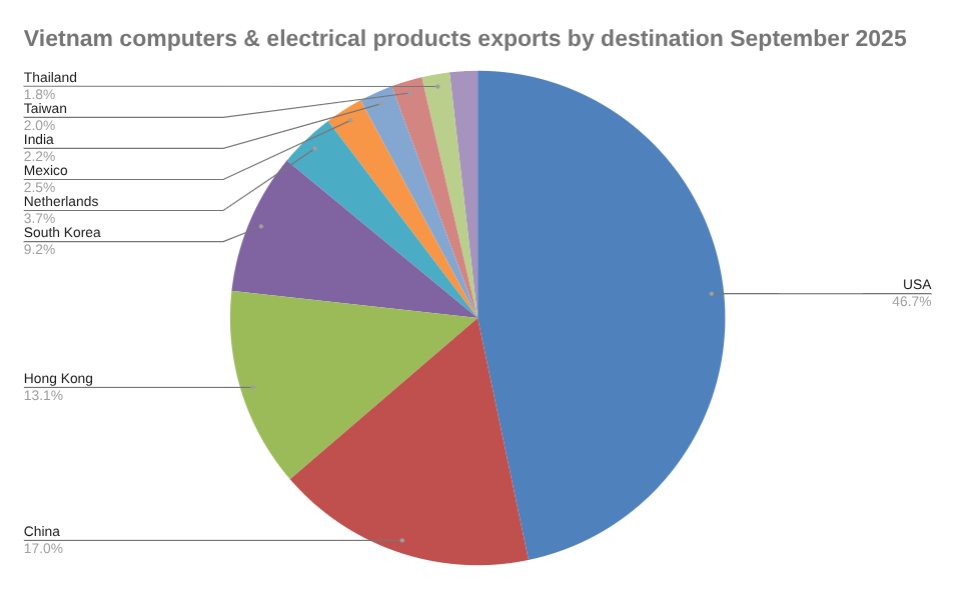
Growth was led by the U.S., which imported US$4.18 billion, up 8.26 percent month-on-month.
South Korea (up 6.61 percent), Germany (up 36.11 percent), and Australia (up 41.48 percent) also recorded notable increases.
Shipments to China rose 1.83 percent, while exports to the Netherlands fell 8.35 percent and to Malaysia by 10.17 percent.
Conversely, Vietnam’s imports of computers, electrical products, spare parts, and components fell 1.35 percent month-on-month to US$13.94 billion in September 2025, with year-to-date imports reaching US$109.98 billion.
Of note, Vietnam’s computers, electrical products, and spare-parts industry is one of the country’s largest export sectors, driven by major investments from global technology manufacturers.
The industry produces a wide range of goods, including computers, semiconductors, circuit boards, and electrical components, primarily for export to the US, China, and the EU.
Foreign direct investment from multinational firms such as Samsung, Intel, and Foxconn has established large-scale production clusters in Bac Ninh, Thai Nguyen, and Ho Chi Minh City.
These facilities not only assemble final products but also support a growing domestic supply chain of spare parts, cables, and accessories.
Investment in the sector is promoted through tax incentives, industrial park development, and policies aimed at boosting local content and value-added manufacturing.
Despite its rapid expansion, however, the industry remains sensitive to global supply chain shifts, trade tensions, and fluctuations in demand for consumer electronics.
Learn more about electronics manufacturing in Vietnam →
Vietnam exports of computers & electrical products in September 2025, US$millions
| September | August | Change | Year to Date | |
| Total | 10,587.25 | 10,149.71 | 4.31% | 77,485.47 |
| Other | 1,638.92 | 1,674.03 | -2.10% | 11,967.94 |
| USA | 4,179.37 | 3,860.43 | 8.26% | 30,276.74 |
| China | 1,520.15 | 1,492.76 | 1.83% | 12,542.37 |
| Hong Kong | 1,168.37 | 1,157.35 | 0.95% | 8,052.64 |
| South Korea | 826.90 | 775.60 | 6.61% | 6,311.57 |
| Netherlands | 329.56 | 359.59 | -8.35% | 2,447.00 |
| Mexico | 222.03 | 205.57 | 8.01% | 1,092.75 |
| India | 196.30 | 183.18 | 7.16% | 1,258.35 |
| Taiwan | 180.83 | 140.72 | 28.50% | 1,219.11 |
| Thailand | 162.68 | 134.76 | 20.72% | 1,172.58 |
| Singapore | 162.14 | 165.71 | -2.16% | 1,144.41 |
| Japan | 154.69 | 150.20 | 2.99% | 1,182.87 |
| UK | 151.52 | 145.39 | 4.22% | 840.74 |
| Germany | 145.48 | 106.89 | 36.11% | 899.50 |
| Australia | 128.00 | 90.47 | 41.48% | 628.59 |
| Slovakia | 108.96 | 130.50 | -16.51% | 772.68 |
| Czech Republic | 102.87 | 86.55 | 18.86% | 659.13 |
| Canada | 80.73 | 74.35 | 8.59% | 649.98 |
| Poland | 79.12 | 75.42 | 4.91% | 557.79 |
| Malaysia | 74.28 | 82.69 | -10.17% | 657.55 |
| Italy | 65.07 | 49.93 | 30.32% | 398.72 |
| UAE | 48.00 | 66.04 | -27.32% | 439.16 |
| Hungary | 44.81 | 55.64 | -19.45% | 324.45 |
| France | 39.76 | 48.20 | -17.51% | 343.11 |
| Brazil | 34.63 | 42.16 | -17.87% | 320.98 |
| Spain | 24.33 | 32.47 | -25.08% | 185.39 |
| Turkey | 23.73 | 22.59 | 5.05% | 164.81 |
| Philippines | 22.24 | 19.59 | 13.57% | 162.46 |
| Indonesia | 16.41 | 17.53 | -6.37% | 180.90 |
| Saudi Arabia | 15.66 | 18.47 | -15.20% | 109.16 |
| Sweden | 13.36 | 14.58 | -8.38% | 117.17 |
| Argentina | 10.69 | 21.86 | -51.10% | 128.40 |
| Chile | 10.05 | 13.15 | -23.54% | 101.85 |
| New Zealand | 9.85 | 7.52 | 31.07% | 64.28 |
| Colombia | 9.15 | 8.35 | 9.62% | 56.99 |
| Kazakhstan | 5.45 | 2.34 | 132.79% | 34.08 |
| South Africa | 4.61 | 7.88 | -41.48% | 67.54 |
| Armenia | 4.03 | 8.13 | -50.42% | 31.55 |
| Peru | 3.95 | 6.26 | -36.90% | 36.01 |
| Portugal | 3.86 | 6.48 | -40.35% | 31.99 |
| Panama | 3.44 | 3.50 | -1.65% | 32.55 |
| Egypt | 3.31 | 3.00 | 10.46% | 33.73 |
| Switzerland | 2.21 | 4.72 | -53.18% | 31.90 |
| Greece | 1.54 | 2.29 | -32.64% | 14.93 |
| Bangladesh | 1.08 | 1.20 | -10.12% | 8.02 |
| Russia | 0.88 | 0.45 | 95.59% | 5.25 |
| Romania | 0.67 | 1.21 | -44.82% | 7.37 |
| Belgium | 0.58 | 1.12 | -48.73% | 7.50 |
| Sri Lanka | 0.47 | 0.88 | -47.08% | 7.08 |
| Finland | 0.40 | 0.31 | 30.29% | 8.40 |
| Nigeria | 0.36 | 0.17 | 107.14% | 1.80 |
| Kyrgyzstan | 0.28 | 0.00 | 0.00% | 1.47 |
| Ukraine | 0.00 | 0.00 | 0.00% | 0.26 |