
Vietnam’s exports of telephones, mobile phones, and parts fell 5.61 percent month-on-month to US$5.41 billion in September 2025, according to the latest data from Vietnam’s General Department of Customs.
Cumulative exports in the first nine months reached US$43.59 billion, underscoring the sector’s continued importance as one of Vietnam’s largest export categories.

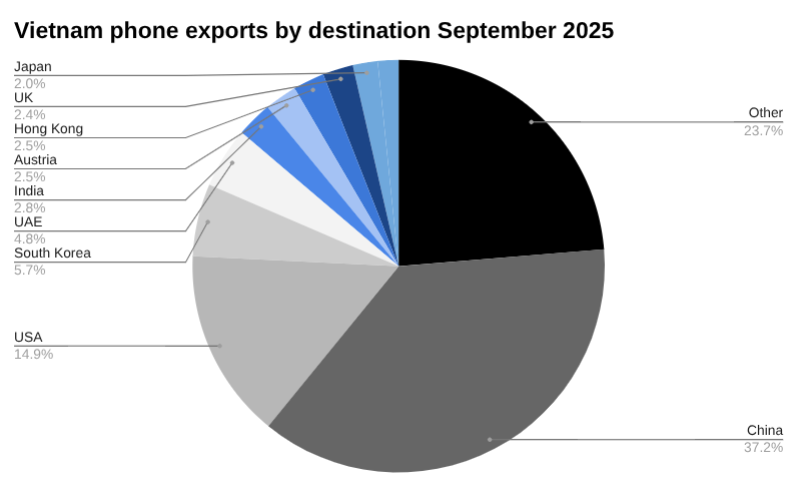
Shipments to China rose 21.48 percent over August to US$2.01 billion, making it Vietnam’s largest market in September. Exports to Saudi Arabia, Australia, Israel, and New Zealand also grew modestly.
However, major declines were seen across key destinations including the United States (-24.38 percent), Japan (-23.11 percent), Mexico (-33.67 percent), and Germany (-43.67 percent).
By contrast, exports to smaller markets such as Bangladesh and the Czech Republic surged on a low base, while traditional partners in Europe and Southeast Asia mostly weakened.
Of note, Vietnam’s imports of telephones, mobile phones, and parts rose 8.9 percent month-on-month to US$1.21 billion in September 2025
Year-to-date imports reached US$8.19 billion with China Vietnam’s dominant supplier accounting for US$1.01 billion of Vietnam’s phone imports in September, up 7.9 percent from August.
Vietnam’s telephones, mobile phones, and parts industry is one of its largest export earners, driven by major manufacturers such as Samsung, Apple suppliers, and a network of supporting electronics firms.
The sector benefits from strong foreign direct investment, low-cost labour, and integrated supply chains that make Vietnam a key production base for global smartphone and component assembly.
The industry’s growth is closely linked to export demand from major markets including China, the United States, South Korea, and the European Union.
While it faces challenges from global demand fluctuations and shifting supply chain strategies, Vietnam continues to attract new investment in high-value components and 5G-related technologies, reinforcing its role as a central hub in the global electronics ecosystem.
Learn more about electronics manufacturing in Vietnam →
Vietnam exports of telephones, mobile phones and parts thereof in September 2025, US$millions
| September | August | Change | Year to Date | |
| Total | 5,407.63 | 5,728.90 | -5.61% | 43,592.20 |
| Other | 1,281.68 | 1,509.93 | -15.12% | 12,221.14 |
| China | 2,010.98 | 1,655.46 | 21.48% | 10,225.16 |
| USA | 804.71 | 1,064.10 | -24.38% | 8,333.30 |
| South Korea | 308.05 | 346.93 | -11.21% | 3,009.65 |
| UAE | 256.95 | 295.29 | -12.98% | 2,430.70 |
| India | 151.90 | 189.36 | -19.78% | 1,730.42 |
| Austria | 137.33 | 167.15 | -17.84% | 1,464.57 |
| Hong Kong | 133.29 | 129.59 | 2.85% | 1,060.96 |
| UK | 129.50 | 149.53 | -13.40% | 1,096.80 |
| Japan | 105.48 | 137.18 | -23.11% | 1,281.46 |
| Saudi Arabia | 87.78 | 84.39 | 4.02% | 738.05 |
| Mexico | 81.45 | 122.80 | -33.67% | 914.85 |
| Thailand | 80.88 | 84.49 | -4.28% | 621.63 |
| Netherlands | 80.50 | 103.25 | -22.03% | 845.20 |
| Australia | 66.35 | 55.47 | 19.61% | 562.55 |
| Italy | 62.27 | 68.46 | -9.04% | 449.12 |
| Slovakia | 60.06 | 61.94 | -3.04% | 435.92 |
| France | 57.61 | 74.05 | -22.21% | 484.03 |
| Armenia | 52.40 | 51.60 | 1.55% | 354.79 |
| Canada | 48.14 | 54.60 | -11.84% | 572.76 |
| Germany | 46.88 | 83.22 | -43.67% | 623.82 |
| Turkey | 44.47 | 53.13 | -16.30% | 390.68 |
| Brazil | 42.37 | 44.17 | -4.09% | 399.76 |
| Sweden | 37.67 | 36.91 | 2.06% | 287.83 |
| Spain | 34.26 | 52.06 | -34.20% | 381.20 |
| Chile | 33.43 | 45.01 | -25.74% | 299.59 |
| Malaysia | 31.68 | 39.76 | -20.33% | 298.91 |
| Taiwan | 25.40 | 36.78 | -30.96% | 290.91 |
| Kazakhstan | 24.75 | 30.16 | -17.95% | 245.77 |
| Singapore | 22.82 | 19.36 | 17.86% | 304.81 |
| Colombia | 22.57 | 25.19 | -10.39% | 165.48 |
| South Africa | 20.48 | 25.22 | -18.77% | 222.82 |
| Argentina | 20.14 | 28.20 | -28.57% | 366.66 |
| Pakistan | 18.90 | 17.33 | 9.04% | 120.14 |
| Poland | 18.04 | 17.96 | 0.42% | 199.74 |
| Philippines | 17.69 | 29.25 | -39.51% | 206.82 |
| Indonesia | 15.52 | 23.11 | -32.83% | 270.38 |
| Israel | 15.48 | 10.96 | 41.27% | 183.84 |
| New Zealand | 14.06 | 11.75 | 19.62% | 134.41 |
| Hungary | 13.76 | 15.66 | -12.12% | 88.34 |
| Peru | 13.05 | 18.51 | -29.51% | 138.62 |
| Panama | 10.44 | 12.55 | -16.83% | 109.94 |
| Egypt | 9.94 | 9.35 | 6.37% | 63.11 |
| Greece | 9.39 | 15.26 | -38.46% | 92.64 |
| Portugal | 7.98 | 15.56 | -48.73% | 81.25 |
| Bangladesh | 5.41 | 0.63 | 752.56% | 13.22 |
| Czech Republic | 4.75 | 2.02 | 134.62% | 9.44 |
| Sri Lanka | 0.43 | 0.81 | -46.31% | 3.72 |
| Cambodia | 0.33 | 0.00 | 0.00% | 0.33 |
| Nigeria | 0.23 | 0.13 | 77.84% | 1.87 |
| Kenya | 0.06 | 0.05 | 34.97% | 0.64 |