
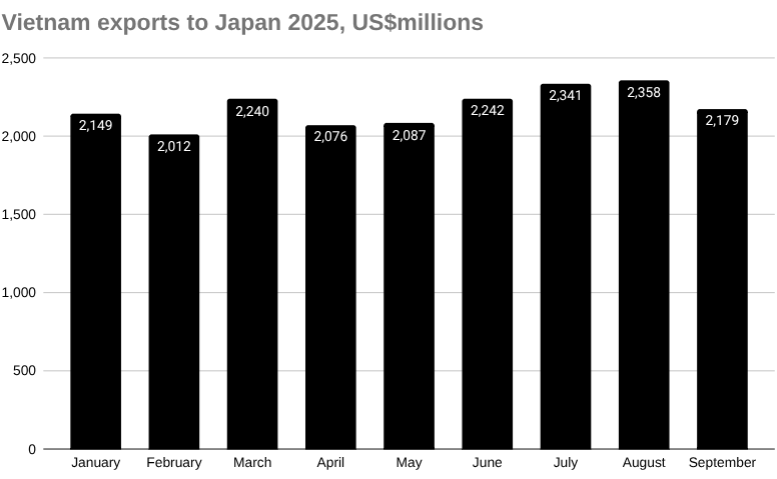
Vietnam’s exports to Japan fell 7.6 percent month-on-month to US$2.18 billion in September 2025, according to Vietnam’s General Department of Customs.
Year-to-date exports reached US$19.65 billion.
Textiles and garments were the largest export category at US$401.02 million, though this fell 8.02 percent from August.
Shipments of other means of transportation and parts dropped 11.6 percent to US$263.11 million, while wood and wooden products declined 22.13 percent to US$161.66 million.
In contrast, exports of machinery, equipment, tools, and instruments rose 5.45 percent to US$233.26 million, and computers, electrical products, and spare parts increased 2.99 percent to US$154.69 million.
Chemicals also rose 10.15 percent to US$39.71 million, alongside growth in yarn, plastics, iron and steel, and glassware exports.
Several key categories, including telephones, footwear, and fishery products, posted notable declines of 23.11 percent, 23.22 percent, and 9.04 percent respectively.
Coal and fertiliser exports recorded the strongest monthly gains, increasing by 130.76 percent and 104.78 percent.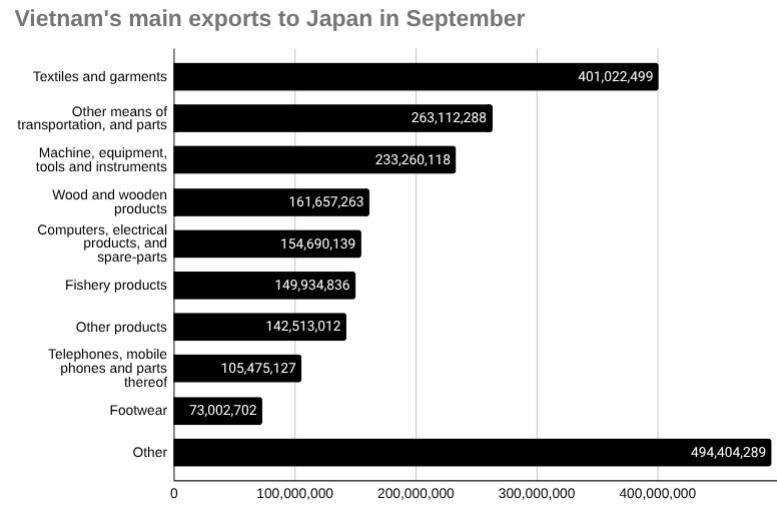
Similarly, Vietnam’s imports from Japan fell by 0.7 percent month-on-month to an estimated US$2.22 billion in September 2025.
From January to September 2025, total imports from Japan reached US$18.24 billion.
Learn more about accessing the Vietnam market →
Vietnam exports to Japan in September 2025 US$millions
| September | August | Change | YTD | |
| Total | 2,179.07 | 2,358.34 | -7.60% | 19,654.91 |
| Textiles and garments | 401.02 | 435.97 | -8.02% | 3,364.32 |
| Other means of transportation, and parts | 263.11 | 297.65 | -11.60% | 2,428.86 |
| Machine, equipment, tools and instruments | 233.26 | 221.20 | 5.45% | 1,979.20 |
| Wood and wooden products | 161.66 | 207.60 | -22.13% | 1,567.84 |
| Computers, electrical products, and spare-parts | 154.69 | 150.20 | 2.99% | 1,182.87 |
| Fishery products | 149.93 | 164.83 | -9.04% | 1,235.73 |
| Other products | 142.51 | 146.50 | -2.72% | 1,241.64 |
| Telephones, mobile phones and parts thereof | 105.48 | 137.18 | -23.11% | 1,281.46 |
| Footwear | 73.00 | 95.08 | -23.22% | 876.03 |
| Plastic products | 61.10 | 62.63 | -2.44% | 552.98 |
| Iron and steel products | 48.02 | 52.77 | -9.01% | 459.99 |
| Toys and sports requisites; parts and accessories | 45.86 | 42.96 | 6.75% | 385.53 |
| Chemicals | 39.71 | 36.05 | 10.15% | 276.54 |
| Insulated wires and cables | 31.19 | 34.00 | -8.26% | 275.97 |
| Coffee | 31.01 | 31.04 | -0.10% | 478.87 |
| Other base metals and other base metal products | 29.63 | 31.83 | -6.92% | 274.61 |
| Handbags, purses, suitcases, and headgear | 23.75 | 28.27 | -16.00% | 296.99 |
| Plastics | 20.66 | 19.66 | 5.09% | 156.95 |
| Fruits and vegetables | 19.18 | 21.48 | -10.70% | 182.53 |
| Still image, video cameras and parts thereof | 16.25 | 16.84 | -3.48% | 106.91 |
| Rubber products | 15.00 | 15.25 | -1.62% | 128.90 |
| Pastries, sweets and cereal products | 14.99 | 15.04 | -0.38% | 107.02 |
| Coal | 11.24 | 4.87 | 130.76% | 33.42 |
| Chemical products | 10.77 | 12.19 | -11.66% | 97.40 |
| Textile, leather and footwear materials | 10.08 | 11.80 | -14.59% | 101.28 |
| Precious stones, precious metal and articles | 7.92 | 8.07 | -1.83% | 62.84 |
| Bamboo and rattan products | 7.69 | 7.63 | 0.89% | 45.40 |
| Ceramic products | 7.55 | 7.71 | -2.03% | 66.33 |
| Yarn | 7.54 | 6.93 | 8.77% | 73.48 |
| Cashew nut | 6.47 | 8.11 | -20.14% | 65.36 |
| Iron and steel | 6.43 | 5.16 | 24.65% | 47.19 |
| Paper and paper products | 6.39 | 6.33 | 1.02% | 55.45 |
| Tyre cord fabrics and other fabrics for technical | 5.75 | 5.96 | -3.43% | 48.22 |
| Glass and glassware | 4.05 | 1.70 | 137.58% | 18.00 |
| Pepper | 1.67 | 2.86 | -41.74% | 19.97 |
| Animal fodders and animal fodder materials | 1.65 | 1.68 | -1.56% | 16.43 |
| Rubber | 1.26 | 1.79 | -29.68% | 13.58 |
| Manioc and manioc products | 0.69 | 0.67 | 3.98% | 4.12 |
| Ores and other minerals product | 0.61 | 0.72 | -15.25% | 12.00 |
| Fertilizers | 0.27 | 0.13 | 104.78% | 13.90 |
| Crude oil | 0.00 | 0.00 | 0.00% | 18.78 |
Vietnam—Japan bilateral trade
Vietnam recorded a trade deficit of US$39.11 million with Japan in September 2025, reversing a surplus of US$124.24 million in August.
Exports fell 7.6 percent month-on-month to US$2.18 billion, while imports slipped 0.71 percent to US$2.22 billion.
Total bilateral trade reached US$4.4 billion for the month, down 4.25 percent from August, bringing year-to-date turnover to US$37.9 billion, with Vietnam maintaining a cumulative surplus of US$1.41 billion.
Vietnam—Japan balance of trade, September 2025 US$millions
| Sep | Aug | Change | YTD | |
| Imports from | 2,218.18 | 2,234.10 | -0.71% | 18,243.05 |
| Exports to | 2,179.07 | 2,358.34 | -7.60% | 19,654.91 |
| Total | 4,397.25 | 4,592.44 | -4.25% | 37,897.96 |
| Balance (Vietnam) | -39.11 | 124.24 | -131.48% | 1,411.86 |
Of note, Vietnam and Japan maintain one of Asia’s most stable and diversified trading relationships, supported by the Vietnam–Japan Economic Partnership Agreement and shared supply chain integration across manufacturing, electronics, and automotive sectors.
Japan consistently ranks among Vietnam’s top trading partners, with two-way trade driven by industrial components, machinery, textiles, and agricultural goods.
Beyond trade, Japan is a leading foreign investor in Vietnam, contributing significantly to infrastructure, energy, and industrial development projects.
This partnership continues to evolve through regional frameworks such as the CPTPP and RCEP, reinforcing both nations’ roles in resilient, high-value production networks across the Asia-Pacific.