
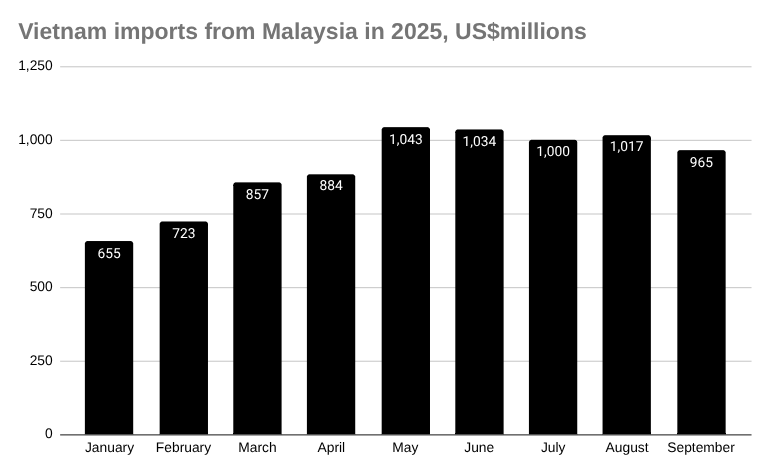
Vietnam’s imports from Malaysia declined 5.06 percent month-on-month to US$965.48 million in September 2025, according to Vietnam’s General Department of Customs.
Year-to-date, total imports reached US$8.18 billion.
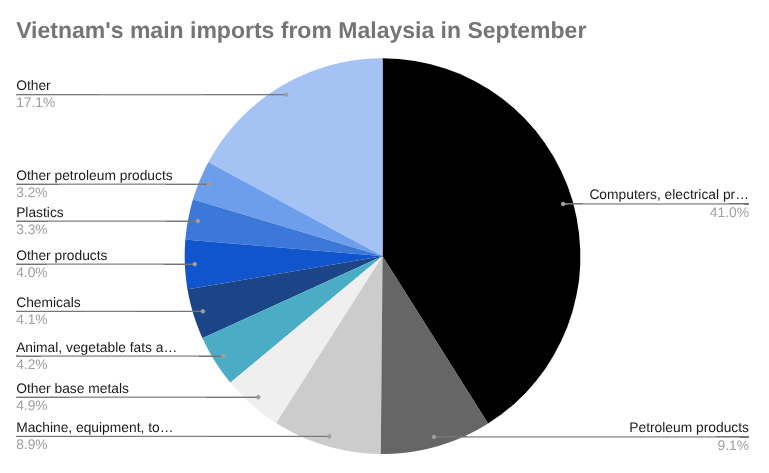
Computers, electrical products, and components remained Vietnam’s largest import group from Malaysia at US$396.29 million, down 8.33 percent from August.
Petroleum products followed at US$87.82 million, falling 10.78 percent, while machinery and tools recorded a smaller 1.13 percent decline to US$85.80 million.
Several categories posted double-digit contractions including other base metals, animal and vegetable oils, and glassware.
In contrast, some products showed strong gains, led by paper up 28.84 percent, iron and steel up 28.56 percent, and fabrics up 23.46 percent.
Chemical imports increased 13.85 percent to US$39.75 million, while other petroleum products surged 738.58 percent to US$31.30 million.
Among smaller categories, tobacco materials rose sharply by 333 percent, though from a low base, while rubber products grew 17.38 percent.
For the first nine months of 2025, computers and electronics accounted for over one-third of Vietnam’s total imports from Malaysia.
Learn more about accessing markets in Vietnam →
Vietnam imports from Malaysia in September 2025, US$millions
| September | August | MoM | YTD | |
| Total | 965.48 | 1,016.98 | -5.06% | 8,178.50 |
| Computers, electrical products, spare-parts and components thereof | 396.29 | 432.28 | -8.33% | 2,970.15 |
| Petroleum products | 87.82 | 98.44 | -10.78% | 839.39 |
| Machine, equipment, tools and instruments | 85.80 | 86.79 | -1.13% | 698.68 |
| Other base metals | 47.63 | 54.39 | -12.43% | 481.62 |
| Animal, vegetable fats and oils | 40.89 | 44.11 | -7.30% | 290.69 |
| Chemicals | 39.75 | 34.91 | 13.85% | 364.83 |
| Other products | 38.80 | 58.70 | -33.91% | 443.64 |
| Plastics | 31.84 | 33.27 | -4.30% | 298.28 |
| Other petroleum products | 31.30 | 3.73 | 738.58% | 64.74 |
| Chemical products | 22.20 | 25.23 | -12.01% | 194.67 |
| Paper | 21.63 | 16.79 | 28.84% | 135.21 |
| Iron and steel | 20.96 | 16.31 | 28.56% | 68.21 |
| Liquefied petroleum gases (LPG) | 15.38 | 16.58 | -7.21% | 291.89 |
| Fabrics | 10.90 | 8.83 | 23.46% | 100.70 |
| Glass and glassware | 9.84 | 12.92 | -23.82% | 91.06 |
| Electric consumer products and parts thereof | 7.61 | 10.66 | -28.62% | 274.91 |
| Plastic products | 7.34 | 8.33 | -11.90% | 72.24 |
| Insulated wires and cables | 7.21 | 7.72 | -6.62% | 75.55 |
| Pastries, sweets and cereal products | 5.82 | 3.96 | 46.88% | 35.74 |
| Other edible food preparations | 5.36 | 5.46 | -1.88% | 51.01 |
| Rubber products | 4.01 | 3.42 | 17.38% | 30.71 |
| Milk and milk products | 3.60 | 3.48 | 3.45% | 39.23 |
| Iron and steel products | 2.80 | 3.96 | -29.44% | 35.71 |
| Animal fodders and animal fodder materials | 2.67 | 2.53 | 5.21% | 22.75 |
| Parts and accessories of motor vehicles | 2.49 | 2.70 | -7.80% | 21.64 |
| Textile, leather and footwear materials | 1.95 | 1.92 | 1.74% | 16.30 |
| Fishery products | 1.93 | 2.62 | -26.18% | 16.68 |
| Yarn | 1.75 | 3.66 | -52.16% | 26.97 |
| Other base metal products | 1.60 | 2.00 | -19.89% | 18.10 |
| Pharmaceutical products | 1.26 | 1.57 | -19.81% | 6.45 |
| Insecticides, rodenticides and materials | 1.11 | 2.33 | -52.42% | 14.29 |
| Rubber | 1.08 | 1.51 | -28.44% | 12.13 |
| Wood and wooden products | 1.03 | 1.36 | -24.51% | 11.12 |
| Essential oils and resinoids; perfumery, cosmetic | 1.01 | 1.01 | 0.20% | 8.65 |
| Paper products | 1.01 | 1.51 | -33.00% | 8.52 |
| Tobacco materials | 0.76 | 0.17 | 333.00% | 5.16 |
| Ores and other minerals product | 0.50 | 0.88 | -43.71% | 9.58 |
| Fruits and vegetables | 0.31 | 0.24 | 28.59% | 2.65 |
| Fertilizers | 0.17 | 0.18 | -7.03% | 25.54 |
| Other means of transportation, parts and accessories thereof | 0.05 | 0.45 | -89.31% | 2.90 |
| Coal | 0.00 | 0.04 | -100.00% | 0.21 |
Vietnam—Malaysia bilateral trade
Vietnam’s trade with Malaysia totalled US$1.40 billion in September 2025, down 3.82 percent from August.
Imports fell 5.06 percent to US$965.48 million, while exports slipped 0.94 percent to US$436.83 million.
Vietnam recorded a trade deficit of US$528.65 million with Malaysia in September, an 8.22 percent improvement from the previous month.
For the first nine months of 2025, the deficit stood at US$4.29 billion, reflecting continued strong import demand from Malaysia.
Vietnam—Malaysia balance of trade, September 2025 US$millions
| September | August | MoM | YTD | |
| Imports | 965.48 | 1,016.98 | -5.06% | 8,178.50 |
| Exports | 436.83 | 440.99 | -0.94% | 3,887.98 |
| Total | 1,402.31 | 1,457.96 | -3.82% | 12,066.48 |
| Balance (Vietnam) | -528.65 | -575.99 | -8.22% | -4,290.52 |
Vietnam and Malaysia maintain a long-standing trade partnership driven by complementary industrial strengths.
Malaysia is a key supplier of electronic components, petroleum products, and machinery to Vietnam, while Vietnam exports processed goods, agricultural products, and textiles to the Malaysian market.
Bilateral trade continues to expand under ASEAN frameworks, with both nations benefiting from regional supply chain integration and free trade agreements.
This relationship supports Vietnam’s manufacturing competitiveness and reinforces Malaysia’s role as a regional supplier of high-value industrial materials and technology inputs.