
Vietnam’s exports to China reached US$7.62 billion in September 2025, up 8.82 percent from August, according to Vietnam’s General Department of Customs.
Year-to-date exports totalled US$49.62 billion, reaffirming China as one of Vietnam’s largest export markets.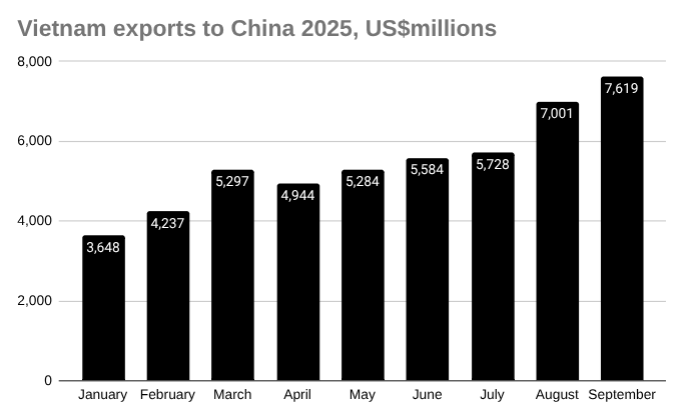
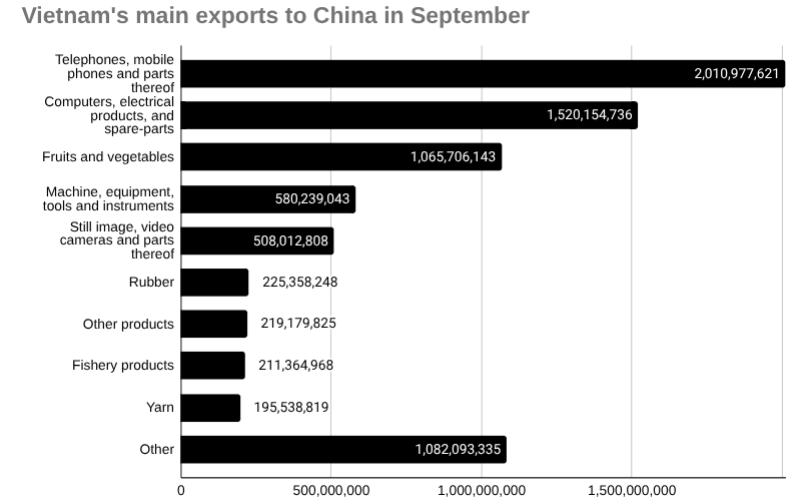
Telephones and parts rose 21.48 percent month-on-month to US$2.01 billion, leading all categories.
Computers and electrical products increased 1.83 percent to US$1.52 billion.
Fruit and vegetable exports jumped 57.11 percent to US$1.07 billion.
Other notable gains included cashew nuts, up 41.29 percent, and chemicals, up 31.75 percent.
Machinery exports edged down 1.70 percent to US$580 million, while rubber fell 13.40 percent to US$225 million.
Textile and garment exports dropped sharply by 44.69 percent, footwear by 55.05 percent, and rice by 49.62 percent.
Conversely, Vietnam imported goods worth US$16.46 billion from China in September 2025, a modest 0.29 percent increase from August
Year-to-date imports reached US$134.4 billion, reaffirming China’s role as Vietnam’s largest and most critical trading partner.
Explore starting a business in Vietnam →
Vietnam—China bilateral trade
Vietnam’s trade with China reached US$24.08 billion in September 2025, up 2.84 percent from August.
Exports rose 8.82 percent to US$7.62 billion, while imports inched up 0.29 percent to US$16.46 billion.
Vietnam’s trade deficit with China narrowed 6.06 percent to US$8.84 billion for the month.
For the first nine months of 2025, total bilateral trade stood at US$184.04 billion, with Vietnam running a cumulative deficit of US$84.79 billion.
Vietnam—China balance of trade, September 2025 US$millions
| September | August | Change | YTD | |
| Imports from | 16,458.59 | 16,411.41 | 0.29% | 134,412.96 |
| Exports to | 7,618.63 | 7,001.30 | 8.82% | 49,624.26 |
| Total | 24,077.21 | 23,412.71 | 2.84% | 184,037.22 |
| Balance (Vietnam) | -8,839.96 | -9,410.10 | -6.06% | -84,788.70 |
Vietnam and China maintain one of the most significant trade relationships in Asia, with China serving as one of Vietnam’s largest trading partners and key supplier of materials, machinery, and intermediate goods.
Trade flows are deeply integrated across manufacturing supply chains, particularly in electronics, textiles, and industrial inputs that support Vietnam’s export-oriented industries.
Vietnam’s exports to China are led by electronics, agricultural products, and raw materials such as rubber and seafood, while imports are dominated by machinery, electrical components, and chemicals.
Despite recurring trade deficits, China remains vital to Vietnam’s industrial development and production networks, reflecting both countries’ interdependence within regional value chains.
Learn more about trade in Vietnam →
Vietnam exports to China in September 2025 US$millions
| September | August | Change | YTD | |
| Total | 7,618.63 | 7,001.30 | 8.82% | 49,624.26 |
| Telephones, mobile phones and parts thereof | 2,010.98 | 1,655.46 | 21.48% | 10,225.16 |
| Computers, electrical products, and spare-parts | 1,520.15 | 1,492.76 | 1.83% | 12,542.37 |
| Fruits and vegetables | 1,065.71 | 678.32 | 57.11% | 3,857.34 |
| Machine, equipment, tools and instruments | 580.24 | 590.25 | -1.70% | 4,026.08 |
| Still image, video cameras and parts thereof | 508.01 | 480.84 | 5.65% | 3,028.82 |
| Rubber | 225.36 | 260.23 | -13.40% | 1,620.29 |
| Other products | 219.18 | 159.54 | 37.39% | 1,418.86 |
| Fishery products | 211.36 | 215.85 | -2.08% | 1,630.38 |
| Yarn | 195.54 | 201.39 | -2.91% | 1,543.13 |
| Wood and wooden products | 177.49 | 184.55 | -3.83% | 1,410.66 |
| Cashew nut | 110.98 | 78.54 | 41.29% | 797.42 |
| Textiles and garments | 99.34 | 179.60 | -44.69% | 1,050.95 |
| Insulated wires and cables | 84.65 | 86.14 | -1.74% | 619.18 |
| Manioc and manioc products | 82.90 | 93.28 | -11.13% | 881.44 |
| Chemicals | 82.27 | 62.44 | 31.75% | 505.43 |
| Footwear | 76.57 | 170.32 | -55.05% | 1,193.93 |
| Animal fodders and animal fodder materials | 62.02 | 59.39 | 4.43% | 444.44 |
| Chemical products | 39.34 | 41.80 | -5.89% | 322.33 |
| Plastics | 33.42 | 19.55 | 70.98% | 190.57 |
| Other means of transportation, and parts | 33.19 | 35.76 | -7.20% | 320.34 |
| Other base metals and other base metal products | 29.52 | 37.76 | -21.81% | 302.40 |
| Toys and sports requisites; parts and accessories | 27.61 | 31.65 | -12.76% | 153.48 |
| Textile, leather and footwear materials | 20.61 | 18.79 | 9.69% | 172.46 |
| Plastic products | 19.22 | 18.72 | 2.67% | 146.37 |
| Rice | 17.85 | 35.43 | -49.62% | 304.55 |
| Petroleum products | 16.66 | 20.70 | -19.51% | 169.50 |
| Coffee | 14.77 | 22.25 | -33.61% | 182.58 |
| Handbags, purses, suitcases, and headgear | 13.92 | 12.26 | 13.55% | 118.81 |
| Iron and steel products | 8.78 | 9.28 | -5.40% | 71.11 |
| Rubber products | 6.47 | 8.10 | -20.13% | 51.49 |
| Pastries, sweets and cereal products | 6.40 | 7.03 | -8.97% | 51.18 |
| Paper and paper products | 6.30 | 6.66 | -5.40% | 116.58 |
| Iron and steel | 2.54 | 1.92 | 31.97% | 20.12 |
| Tyre cord fabrics and other fabrics for technical | 2.11 | 1.34 | 57.12% | 14.77 |
| Glass and glassware | 2.02 | 1.04 | 94.91% | 9.92 |
| Tea | 1.75 | 2.13 | -18.03% | 15.42 |
| Ceramic products | 1.38 | 1.98 | -30.37% | 9.77 |
| Furnitures of other materials, other than of wood | 1.07 | 1.26 | -14.88% | 8.79 |
| Bamboo and rattan products | 0.96 | 1.67 | -42.61% | 7.83 |
| Ores and other minerals product | 0.00 | 15.33 | -100.00% | 68.00 |