
In February, Vietnam imported US$907.66 million worth of goods from Malaysia, down from US$1,035.23 million in January, a change of -12.32 percent, according to preliminary data from Vietnam’s General Department of Customs.
So far this year, Vietnam has imported US$1,944 million worth of goods from Malaysia. 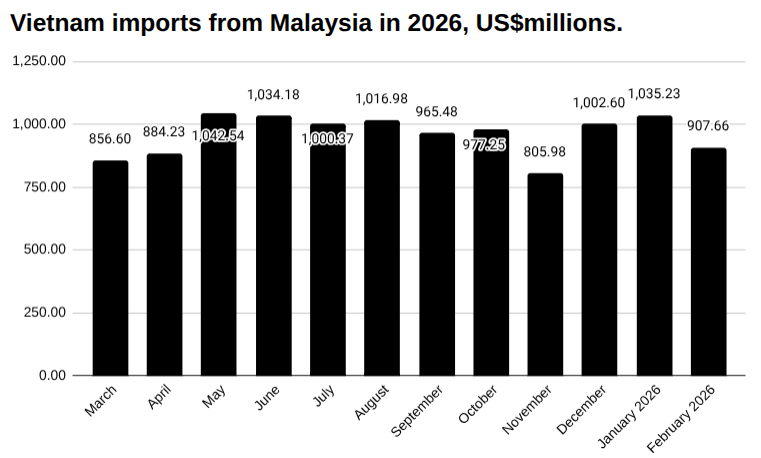
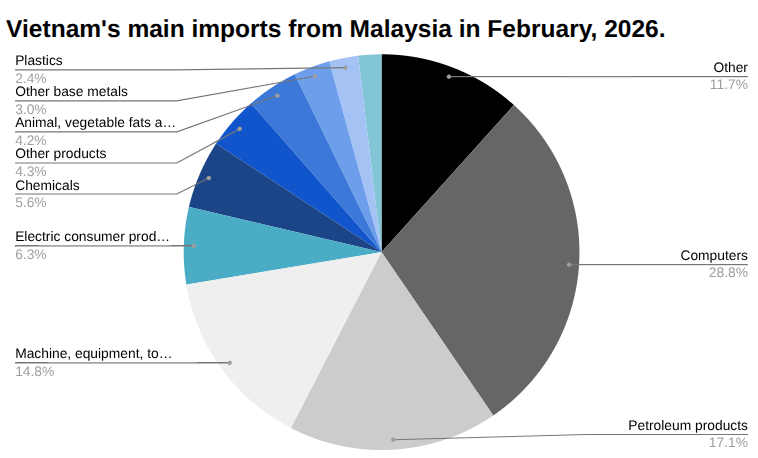
Vietnam imported US$261.30 million worth of computers from Malaysia in February, down from US$307.58 million in January, a change of -15.04 percent.
Vietnam imported US$155.33 million worth of petroleum products from Malaysia in February, down from US$171.82 million in January, a change of -9.60 percent.
Vietnam imported US$134.47 million worth of machines, equipment, tools and instruments from Malaysia in February, up from US$124.52 million in January, a change of 7.99 percent.
Vietnam imported US$57.13 million worth of electric consumer products and parts thereof from Malaysia in February, up from US$26.16 million in January, a change of 118.39 percent.
Vietnam imported US$50.43 million worth of chemicals from Malaysia in February, down from US$54.22 million in January, a change of -7.00 percent.
Learn more about manufacturing in Vietnam→
Vietnam trade with Malaysia
In February, Vietnam imported US$907.66 million worth of goods from Malaysia and exported US$412.90 million to Malaysia, for total trade worth US$1,320.56 million, and leaving a trade deficit of US$494.77 million.
Two-way trade so far this year between Vietnam and Malaysia has reached US$2,897 million, with Vietnam importing US$1,944 million worth of goods and exporting US$952 million worth of goods.
Discover more about trade in Vietnam→
Vietnam-Malaysia news
Recent developments involving the two countries include:
Exports to Malaysia in February
In February, Vietnam exported US$413 million worth of goods to Malaysia, down 23.40 percent over January, according to preliminary data from Vietnam’s General Department of Customs. Read more→
See the latest Vietnam news headlines→
Vietnam-Malaysia trade relations
Vietnam and Malaysia established diplomatic relations in 1973 and have since developed strong economic ties supported by regional frameworks such as the ASEAN Free Trade Area and the Regional Comprehensive Economic Partnership.
Bilateral trade has grown steadily over the decades, with both countries integrating into regional supply chains and expanding cooperation across manufacturing, energy, agriculture, and services.
Malaysia is a key trading partner and investor in Vietnam, particularly in sectors such as oil and gas, real estate, and manufacturing, while Vietnam exports electronics, machinery, and agricultural products to Malaysia.
Ongoing cooperation is supported by government-to-government agreements, business councils, and efforts to facilitate trade, investment, and connectivity within Southeast Asia.
Explore starting a business in Vietnam→
The data
Vietnam imports from Malaysia in February US$m
| February | January | MoM | YTD | |
| Imports | 907.66 | 1,035.23 | -12.32% | 1,944.39 |
| Exports | 412.90 | 539.02 | -23.40% | 952.12 |
| Total | 1,320.56 | 1,574.25 | -16.11% | 2,896.50 |
| Balance | -494.77 | -496.21 | -0.29% | -992.27 |
Vietnam trade with Malaysia year to date US$m
| February | January | MoM | YTD | |
| Total | 907.66 | 1,035.23 | -12.32% | 1,944.39 |
| Computers | 261.30 | 307.58 | -15.04% | 572.62 |
| Petroleum products | 155.33 | 171.82 | -9.60% | 334.45 |
| Machine, equipment, tools and instruments | 134.47 | 124.52 | 7.99% | 259.24 |
| Electric consumer products and parts thereof | 57.13 | 26.16 | 118.39% | 80.91 |
| Chemicals | 50.43 | 54.22 | -7.00% | 104.64 |
| Other products | 39.04 | 36.18 | 7.92% | 75.21 |
| Animal, vegetable fats and oils | 38.50 | 50.63 | -23.96% | 89.12 |
| Other base metals | 26.90 | 43.92 | -38.76% | 70.83 |
| Plastics | 21.55 | 26.27 | -17.99% | 47.82 |
| Chemical products | 17.17 | 20.52 | -16.31% | 37.68 |
| Liquefied petroleum gases (lpg) | 13.84 | 14.76 | -6.21% | 28.59 |
| Paper | 11.83 | 18.46 | -35.94% | 30.29 |
| Fabrics | 8.76 | 10.47 | -16.32% | 19.24 |
| Plastic products | 6.55 | 8.51 | -23.05% | 16.37 |
| Ores and other minerals product | 6.28 | 4.84 | 29.70% | 11.11 |
| Other edible food preparations | 6.07 | 7.96 | -23.72% | 14.04 |
| Insulated wires and cables | 4.05 | 8.29 | -51.18% | 14.87 |
| Glass and glassware | 4.01 | 5.30 | -24.36% | 9.65 |
| Pastries, sweets and cereal products | 3.83 | 6.16 | -37.86% | 9.99 |
| Iron and steel products | 3.77 | 4.84 | -22.17% | 8.61 |
| Rubber products | 3.61 | 4.44 | -18.74% | 8.05 |
| Other petroleum products | 3.56 | 4.72 | -24.52% | 8.29 |
| Animal fodders and animal fodder materials | 3.29 | 15.47 | -78.75% | 7.16 |
| Milk and milk products | 3.26 | 4.00 | -18.63% | 7.26 |
| Pharmaceutical products | 2.99 | 2.59 | 15.27% | 5.58 |
| Other means of transportation, parts and accessories thereof | 2.92 | 0.03 | 9725.86% | 2.95 |
| Insecticides, rodenticides and materials | 2.60 | 1.67 | 56.13% | 4.27 |
| Fishery products | 2.34 | 2.26 | 3.50% | 4.60 |
| Parts and accessories of motor vehicles | 2.14 | 2.02 | 5.63% | 4.16 |
| Textile and footwear materials | 1.98 | 2.15 | -7.89% | 4.12 |
| Iron and steel | 1.67 | 30.08 | -94.45% | 31.75 |
| Other base metal products | 1.35 | 2.37 | -43.00% | 3.73 |
| Yarn | 1.27 | 5.07 | -74.90% | 6.35 |
| Rubber | 1.02 | 1.72 | -40.66% | 2.74 |
| Wood and wooden products | 0.91 | 2.21 | -58.61% | 3.12 |
| Essential oils and resinoids; perfumery, cosmetic or toilet preparations | 0.70 | 1.09 | -36.26% | 1.78 |
| Paper products | 0.62 | 1.31 | -52.77% | 1.93 |
| Fruits and vegetables | 0.27 | 0.37 | -25.93% | 0.64 |
| Tobacco materials | 0.27 | 0.17 | 58.12% | 0.44 |
| Fertilizers | 0.08 | 0.09 | -5.37% | 0.17 |
| Coal | 0.05 | 0.00 | 0.00% | 0.06 |