
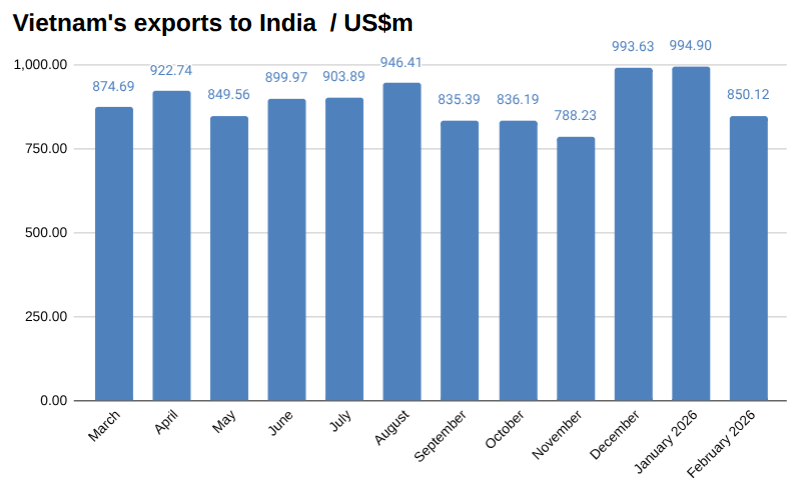
In February, Vietnam exported US$850 million worth of goods to India, down 14.55 percent over January, according to preliminary data from Vietnam’s General Department of Customs.
So far this year, Vietnam has exported US$1,846 million worth of goods to India.
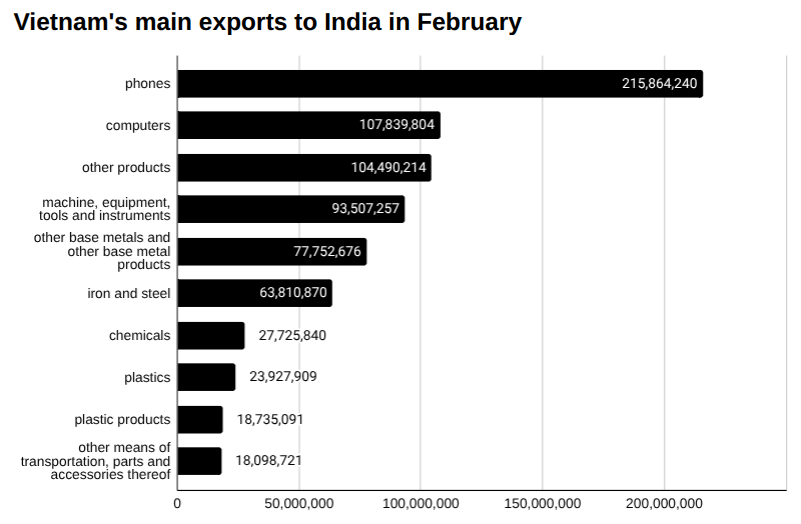
Vietnam exported US$215.86 million worth of phones to India in February, up from US$149.39 million in January, a change of 44.50 percent.
It also exported US$107.84 million worth of computers to India in February, down from US$196.16 million in January, a change of -45.02 percent.
Vietnam exported US$93.51 million worth of machines, equipment, tools and instruments to India in February, up slightly from US$93.25 million in January, a change of 0.28 percent.
It also exported US$77.75 million worth of other base metals and other base metal products to India in February, down from US$103.68 million in January, a change of -25.01 percent.
Learn more about manufacturing in Vietnam→
Vietnam’s trade with India
In February, Vietnam imported US$475.74 million worth of goods from India and exported US$850.12 million to India, for total trade worth US$1,325.87 million, and leaving a trade surplus of US$374.38 million.
Two-way trade so far this year between Vietnam and India has reached US$3,005 million, with Vietnam importing US$1,160 million worth of goods and exporting US$1,846 million worth of goods.
Discover more about trade in Vietnam→
Vietnam-India news
Recent developments involving the two countries include:
Exports to India
In January, Vietnam exported US$995 million worth of goods to India, up 0.13 percent over December, according to preliminary data from Vietnam’s General Department of Customs. Read more→
See the latest Vietnam news headlines→
Vietnam-India trade relations
Vietnam and India established diplomatic relations in 1972, building on earlier political ties during the Cold War and expanding into a Comprehensive Strategic Partnership in 2016.
Trade has grown steadily over the past decade, supported by frameworks such as the ASEAN India Trade in Goods Agreement and broader cooperation through ASEAN led mechanisms.
Bilateral engagement spans energy, pharmaceuticals, agriculture, textiles, and information technology, with both governments promoting supply chain diversification and market access.
Explore starting a business in Vietnam→
The data
Vietnam trade with India year to date February 2026 US$m
| February | January | Change | YTD | |
| Imports | 475.74 | 678.58 | -29.89% | 1,159.74 |
| Exports | 850.12 | 994.90 | -14.55% | 1,845.56 |
| Total | 1,325.87 | 1,673.48 | -20.77% | 3,005.31 |
| Balance | 374.38 | 316.31 | 18.36% | 685.82 |
Vietnam exports to India in February 2026 US$m
| February | January | Change | YTD | |
| Total | 850.12 | 994.90 | -14.55% | 1,845.56 |
| Phones | 215.86 | 149.39 | 44.50% | 365.25 |
| Computers | 107.84 | 196.16 | -45.02% | 304.00 |
| Other products | 104.49 | 148.22 | -29.50% | 252.78 |
| Machine, equipment, tools and instruments | 93.51 | 93.25 | 0.28% | 186.76 |
| Other base metals and other base metal products | 77.75 | 103.68 | -25.01% | 181.43 |
| Iron and steel | 63.81 | 69.33 | -7.97% | 133.15 |
| Chemicals | 27.73 | 17.44 | 59.01% | 45.59 |
| Plastics | 23.93 | 28.07 | -14.76% | 52.00 |
| Plastic products | 18.74 | 28.47 | -34.19% | 47.21 |
| Other means of transportation, parts and accessories thereof | 18.10 | 25.11 | -27.92% | 43.21 |
| Textiles and garments | 16.10 | 22.77 | -29.29% | 38.87 |
| Rubber | 11.66 | 12.88 | -9.45% | 24.53 |
| Footwear | 11.38 | 15.76 | -27.78% | 27.14 |
| Textile and footwear materials | 10.66 | 16.20 | -34.19% | 26.85 |
| Chemical products | 10.06 | 10.07 | -0.10% | 20.14 |
| Coffee | 8.62 | 14.24 | -39.46% | 22.86 |
| Iron and steel products | 8.45 | 8.11 | 4.23% | 16.56 |
| Yarn | 4.36 | 6.70 | -34.95% | 11.06 |
| Animal fodders and animal fodder materials | 3.63 | 4.93 | -26.49% | 8.56 |
| Wood and wood products | 3.40 | 7.71 | -55.86% | 11.15 |
| Pepper | 3.25 | 6.04 | -46.23% | 9.28 |
| Bamboo and rattan products | 2.90 | 3.85 | -24.50% | 6.75 |
| Rubber products | 1.45 | 1.95 | -25.91% | 3.40 |
| Fishery products | 1.04 | 2.34 | -55.54% | 3.37 |
| Ceramic products | 0.49 | 0.61 | -19.87% | 1.09 |
| Cashew nut | 0.43 | 0.29 | 51.19% | 0.72 |
| Tea | 0.30 | 0.93 | -67.53% | 1.23 |
| Pastry, sweets and cereals products | 0.19 | 0.42 | -53.73% | 0.61 |
| Coal | 0.00 | 0.00 | 0.00% | 0.00 |