
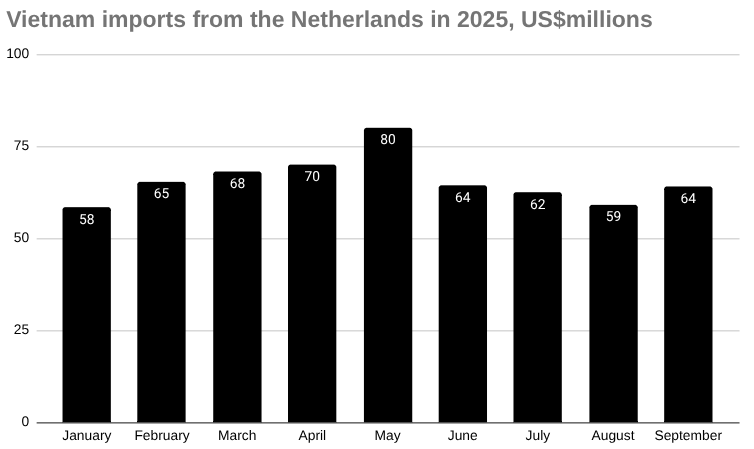
Vietnam’s imports from the Netherlands rose 8.46 percent month-on-month to US$64.12 million in September 2025, according to preliminary data from Vietnam’s General Department of Customs.
Total imports in the first nine months reached US$587.16 million.
Machine, equipment, tools and instruments were among the largest import categories, increasing 9.84 percent to US$12 million.
Milk and milk products rose 20.01 percent to US$4.14 million, while edible food preparations surged 137.67 percent to US$4.14 million.
Pharmaceutical imports declined 34.09 percent to US$6.94 million, and chemical products fell 3.47 percent to US$3 million.
Iron and steel products increased sharply by 76.78 percent to US$2.11 million, while plastics decreased 8.44 percent to US$2.90 million.
Animal fodder imports fell 33.88 percent to US$1.69 million, and plastic products dropped 25.17 percent to US$0.95 million.
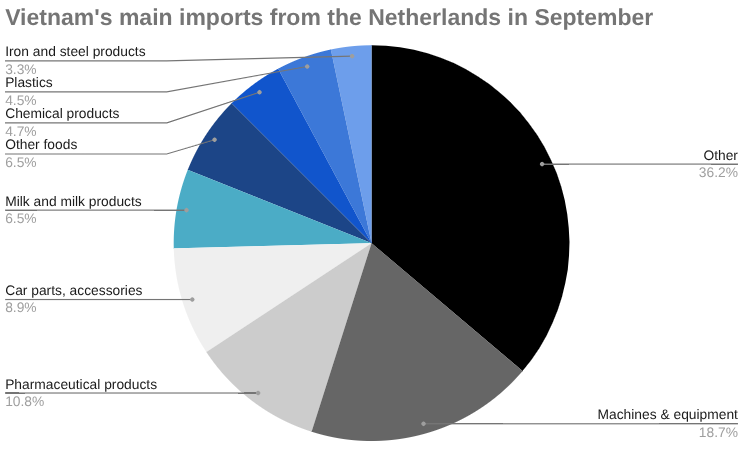
The rise in imports from the Netherlands was driven by machinery, dairy, and processed food categories, balancing declines in pharmaceuticals and industrial materials.
Learn more about accessing Vietnam’s consumer market→
Vietnam imports from Netherlands in September 2025, US$millions
| September | August | MoM | YTD | |
| Total | 64.12 | 59.12 | 8.46% | 587.16 |
| Other products | 17.92 | 13.01 | 37.77% | 152.11 |
| Machine, equipment, tools and instruments | 12.00 | 10.93 | 9.84% | 134.44 |
| Pharmaceutical products | 6.94 | 10.53 | -34.09% | 73.36 |
| Parts and accessories of motor vehicles | 5.68 | 5.73 | -0.94% | 42.36 |
| Milk and milk products | 4.14 | 3.45 | 20.01% | 36.35 |
| Other edible food preparations | 4.14 | 1.74 | 137.67% | 25.21 |
| Chemical products | 3.00 | 3.11 | -3.47% | 30.37 |
| Plastics | 2.90 | 3.17 | -8.44% | 22.81 |
| Iron and steel products | 2.11 | 1.20 | 76.78% | 17.37 |
| Animal fodders and animal fodder materials | 1.69 | 2.55 | -33.88% | 17.45 |
| Plastic products | 0.95 | 1.27 | -25.17% | 7.43 |
| Chemicals | 0.65 | 0.91 | -28.59% | 7.51 |
| Yarn | 0.61 | 0.18 | 240.70% | 3.31 |
| Computers, electrical products, spare-parts and components thereof | 0.52 | 0.32 | 62.28% | 3.84 |
| textile, leather and footwear materials and auxiliaries | 0.29 | 0.26 | 8.86% | 3.71 |
| Insulated wires and cables | 0.25 | 0.08 | 209.56% | 1.98 |
| Pastries, sweets and cereal products | 0.13 | 0.18 | -29.84% | 1.22 |
| Rubber | 0.10 | 0.08 | 21.84% | 0.92 |
| Other means of transportation, parts and accessories thereof | 0.07 | 0.16 | -55.91% | 3.84 |
| Iron and steel | 0.02 | 0.09 | -76.20% | 0.99 |
| Glass and glassware | 0.00 | 0.17 | -100.00% | 0.57 |
Vietnam trade with the Netherlands
Vietnam recorded a trade surplus of US$1.08 billion with the Netherlands in September 2025, narrowing 5.56 percent from August.
Exports to the Netherlands fell 4.87 percent month-on-month to US$1.14 billion, while imports rose 8.46 percent to US$64.12 million.
Total two-way trade reached US$1.21 billion for the month and US$10.38 billion year-to-date.
Vietnam’s cumulative trade surplus with the Netherlands stood at US$9.21 billion, underscoring the Netherlands’ role as one of Vietnam’s key export markets in the European Union.
Vietnam trade with Netherlands September 2025 US$millions
| September | August | MoM | YTD | |
| Imports | 64.12 | 59.12 | 8.46% | 587.16 |
| Exports | 1,142.60 | 1,201.06 | -4.87% | 9,793.02 |
| Total | 1,206.72 | 1,260.18 | -4.24% | 10,380.18 |
| Balance | 1,078.48 | 1,141.94 | -5.56% | 9,205.87 |
Vietnam-Netherlands trade structure
Vietnam and the Netherlands maintain a strong and diversified trade relationship, with the Netherlands serving as one of Vietnam’s largest trading partners in the European Union.
Trade between the two countries is characterised by Vietnam’s exports of electronics, machinery, footwear, and agricultural goods, and imports of machinery, dairy, pharmaceuticals, and chemical products from the Netherlands.
The partnership benefits from the EU–Vietnam Free Trade Agreement, which has supported lower tariffs and greater investment flows.
Bilateral cooperation continues to expand in logistics, renewable energy, and high-tech industries, reflecting shared priorities in sustainable economic growth.