
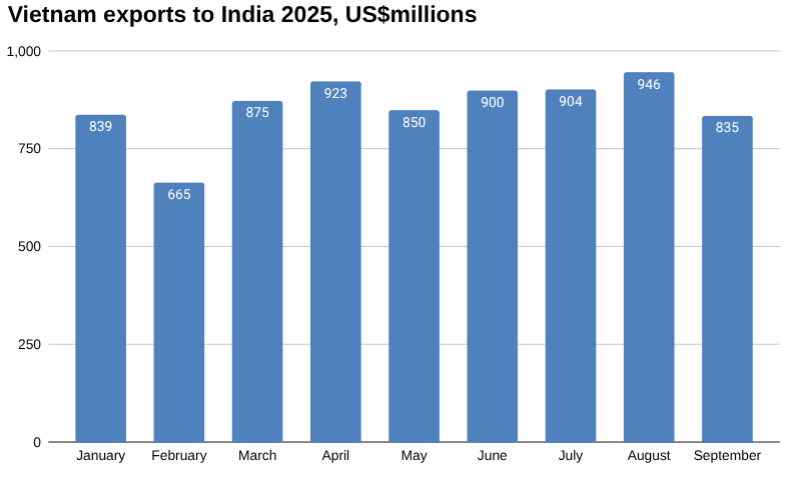
Vietnam’s exports to India fell by 11.73 percent in September 2025 to US$835.39 million from US$946.41 million in August, according to preliminary data from Vietnam’s General Department of Customs.
Year-to-date exports reached US$7.73 billion.
Computers and electrical products were the leading category at US$196.30 million, up 7.16 percent month-on-month.
Telephones and parts followed with US$151.90 million, down 19.78 percent.
Other significant exports included machines and tools at US$89.47 million, other base metals at US$58.97 million, and iron and steel at US$35.01 million.
Chemical and plastic exports saw declines, while wood products, animal fodders, and pastries recorded strong monthly growth.

India remains a key trading partner for Vietnam, particularly in electronics, metals, and manufactured goods.
Learn more about sourcing goods and materials from Vietnam→
Vietnam exports to India in September 2025 US$millions
| September | August | Change | YTD | |
| Total | 835.39 | 946.41 | -11.73% | 7,726.07 |
| Computers, electrical products, and spare-parts | 196.30 | 183.18 | 7.16% | 1,258.35 |
| Telephones, mobile phones and parts thereof | 151.90 | 189.36 | -19.78% | 1,730.42 |
| Other products | 107.51 | 164.08 | -34.48% | 994.59 |
| Machine, equipment, tools and instruments | 89.47 | 92.04 | -2.79% | 759.90 |
| Other base metals and other base metal products | 58.97 | 51.60 | 14.29% | 605.26 |
| Iron and steel | 35.01 | 55.52 | -36.95% | 510.87 |
| Chemicals | 28.70 | 34.64 | -17.16% | 316.31 |
| Plastic products | 20.39 | 27.30 | -25.31% | 213.78 |
| Other means of transportation, and parts | 20.09 | 17.44 | 15.18% | 173.78 |
| Textiles and garments | 19.74 | 19.62 | 0.63% | 155.67 |
| Chemical products | 17.29 | 14.09 | 22.67% | 123.30 |
| Textile, leather and footwear materials | 15.38 | 15.74 | -2.27% | 138.06 |
| Plastics | 14.05 | 7.70 | 82.38% | 101.70 |
| Footwear | 11.02 | 13.64 | -19.16% | 76.40 |
| Rubber | 9.37 | 20.10 | -53.38% | 113.97 |
| Iron and steel products | 9.10 | 9.87 | -7.80% | 99.71 |
| Wood and wooden products | 7.72 | 6.36 | 21.43% | 91.34 |
| Yarn | 4.82 | 6.46 | -25.34% | 54.34 |
| Animal fodders and animal fodder materials | 4.37 | 2.06 | 112.69% | 30.81 |
| Bamboo and rattan products | 3.00 | 2.59 | 15.55% | 24.51 |
| Pepper | 2.57 | 2.93 | -12.44% | 71.01 |
| Coffee | 2.35 | 4.51 | -47.91% | 22.07 |
| Fishery products | 1.97 | 1.68 | 16.84% | 15.05 |
| Rubber products | 1.81 | 1.41 | 27.99% | 14.70 |
| Cashew nut | 1.10 | 1.35 | -18.60% | 14.61 |
| Ceramic products | 0.60 | 0.67 | -11.10% | 5.35 |
| Tea | 0.41 | 0.30 | 35.90% | 3.74 |
| Pastries, sweets and cereal products | 0.39 | 0.17 | 129.23% | 2.39 |
| Coal | 0.00 | 0.00 | 0.00% | 4.06 |
Vietnam-India trade
Vietnam’s trade with India totalled US$1.33 billion in September 2025, down 8.78 percent from August.
Exports fell 11.73 percent month-on-month to US$835.39 million, while imports declined 3.34 percent to US$497.57 million.
Vietnam maintained a trade surplus of US$337.82 million in September, narrowing from US$431.63 million in August.
For the first nine months of 2025, total two-way trade reached US$12.08 billion, with Vietnam recording a surplus of US$3.38 billion.
Explore Vietnam’s role in international trade→
Vietnam trade with India year to date September 2025 US$millions
| Sep | Aug | Change | YTD | |
| Imports | 497.57 | 514.78 | -3.34% | 4,350.42 |
| Exports | 835.39 | 946.41 | -11.73% | 7,726.07 |
| Total | 1,332.96 | 1,461.19 | -8.78% | 12,076.50 |
| Balance (Vietnam) | 337.82 | 431.63 | -21.73% | 3,375.65 |
Vietnam and India maintain one of the most dynamic trade relationships in Asia, built on diversified flows of goods and expanding investment cooperation.
Vietnam mainly exports electronics, machinery, iron and steel, and agricultural commodities to India, while importing pharmaceuticals, chemicals, cotton, and machinery components.
Bilateral trade has steadily grown under the ASEAN–India Free Trade Area and multiple sectoral partnerships.
Both countries continue to promote connectivity and supply chain integration, viewing each other as key markets in their respective regional strategies.