
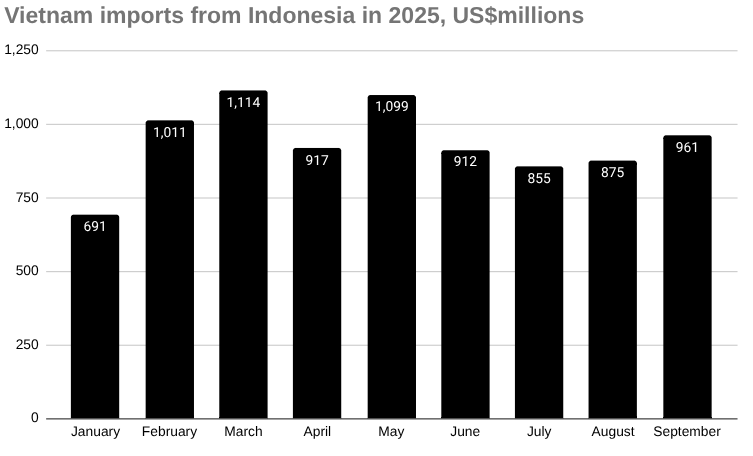
Vietnam’s imports from Indonesia rose to US$961.26 million in September 2025, up 9.83 percent from August, according to preliminary data from Vietnam’s General Department of Customs.
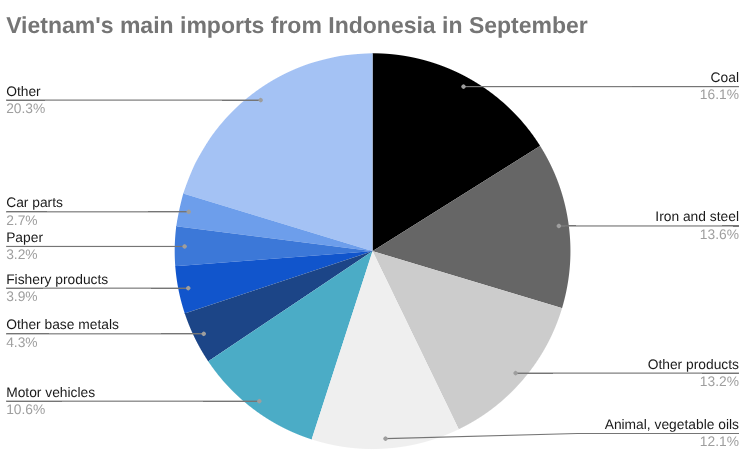
Coal was the largest import category at US$154.52 million, increasing 11 percent month on month.
Iron and steel followed at US$130.48 million, up 11.89 percent, while imports of other products rose 25.93 percent to US$126.68 million.
Animal and vegetable fats and oils surged 39.11 percent to US$116.79 million.
Motor vehicle imports grew 11.61 percent to US$102.12 million, while parts and accessories of motor vehicles reached US$25.94 million, up 17.74 percent.
Imports of chemical products edged up 2.87 percent to US$18.50 million, and chemicals jumped 83.07 percent to US$14.15 million.
Paper imports increased 22.65 percent to US$30.92 million, while plastics fell 14.66 percent to US$13.16 million.
Cashew nut imports saw a sharp rise of 523.80 percent to US$2.93 million, and paper products increased 53.50 percent to US$2.43 million.
In contrast, pharmaceutical products declined 49.85 percent to US$1.14 million, and rubber products dropped 25.29 percent to US$1.10 million.
Year to date, Vietnam’s total imports from Indonesia reached US$8.45 billion, highlighting Indonesia’s position as a key regional supplier across energy, metals, and manufacturing inputs.
Learn more about accessing Vietnam’s consumer market→
Vietnam imports from Indonesia in September 2025, US$millions
| September | August | MoM | YTD | |
| Total | 961.26 | 875.23 | 9.83% | 8,448.73 |
| Coal | 154.52 | 139.21 | 11.00% | 1,618.74 |
| Iron and steel | 130.48 | 116.61 | 11.89% | 1,138.55 |
| Other products | 126.68 | 100.60 | 25.93% | 756.83 |
| Animal, vegetable fats and oils | 116.79 | 83.96 | 39.11% | 709.01 |
| Motor vehicles | 102.12 | 91.50 | 11.61% | 838.50 |
| Other base metals | 41.34 | 59.40 | -30.41% | 542.75 |
| Fishery products | 37.36 | 35.62 | 4.89% | 344.93 |
| Paper | 30.92 | 25.21 | 22.65% | 262.31 |
| Parts and accessories of motor vehicles | 25.94 | 22.03 | 17.74% | 238.03 |
| Computers, electrical products, spare-parts and components thereof | 23.64 | 36.21 | -34.71% | 393.26 |
| Machine, equipment, tools and instruments | 18.53 | 19.16 | -3.28% | 167.93 |
| Chemical products | 18.50 | 17.98 | 2.87% | 156.72 |
| Animal fodders and animal fodder materials | 14.19 | 14.37 | -1.22% | 121.46 |
| Chemicals | 14.15 | 7.73 | 83.07% | 117.29 |
| Plastics | 13.16 | 15.42 | -14.66% | 144.32 |
| Pastries, sweets and cereal products | 12.30 | 12.81 | -3.98% | 91.42 |
| Essential oils and resinoids; perfumery, cosmetic | 10.39 | 7.77 | 33.70% | 76.12 |
| Rubber | 8.80 | 10.62 | -17.18% | 79.61 |
| Yarn | 8.18 | 8.20 | -0.20% | 73.27 |
| Fabrics | 7.69 | 6.66 | 15.56% | 74.53 |
| Other edible food preparations | 6.12 | 4.56 | 34.41% | 39.24 |
| Insulated wires and cables | 4.82 | 4.26 | 13.14% | 41.81 |
| textile, leather and footwear materials and auxiliaries | 4.72 | 5.53 | -14.61% | 47.25 |
| Plastic products | 4.39 | 3.41 | 28.66% | 38.64 |
| Glass and glassware | 4.14 | 3.70 | 11.98% | 22.61 |
| Insecticides, rodenticides and materials | 4.11 | 5.36 | -23.37% | 29.89 |
| Cashew nut | 2.93 | 0.47 | 523.80% | 29.20 |
| Paper products | 2.43 | 1.58 | 53.50% | 29.82 |
| Wood and wooden products | 1.89 | 2.07 | -8.55% | 19.96 |
| Iron and steel products | 1.62 | 1.70 | -4.89% | 14.01 |
| Electric consumer products and parts thereof | 1.56 | 2.10 | -26.09% | 47.54 |
| Other petroleum products | 1.47 | 1.65 | -10.88% | 10.49 |
| Cotton | 1.33 | 1.68 | -20.87% | 14.49 |
| Fertilizers | 1.18 | 1.40 | -15.90% | 32.29 |
| Pharmaceutical products | 1.14 | 2.27 | -49.85% | 12.49 |
| Rubber products | 1.10 | 1.47 | -25.29% | 13.06 |
| Tobacco materials | 0.40 | 0.59 | -32.74% | 58.42 |
| Other base metal products | 0.22 | 0.36 | -38.92% | 1.93 |
Vietnam—Indonesia trade
Vietnam recorded a trade deficit of US$522.77 million with Indonesia in September 2025, widening 34.62 percent from August.
Imports from Indonesia reached US$961.26 million, up 9.83 percent month on month, while exports to Indonesia fell 9.94 percent to US$438.49 million.
Total bilateral trade rose slightly by 2.76 percent to US$1.40 billion.
For the year to date, Vietnam’s exports to Indonesia stood at US$4.27 billion, compared with imports of US$8.45 billion, resulting in a cumulative trade deficit of US$4.18 billion.
Learn more about trade in Indonesia→
Vietnam trade with Indonesia, September 2025 US$millions
| September | August | MoM | YTD | |
| Imports | 961.26 | 875.23 | 9.83% | 8,448.73 |
| Exports | 438.49 | 486.90 | -9.94% | 4,271.60 |
| Total | 1,399.74 | 1,362.13 | 2.76% | 12,720.33 |
| Balance (Vietnam) | -522.77 | -388.33 | 34.62% | -4,177.12 |
Vietnam—Indonesia trading relationship
Vietnam and Indonesia maintain one of the strongest trade relationships within ASEAN, driven by complementary export and import structures.
Vietnam primarily imports coal, iron and steel, fats and oils, and motor vehicles from Indonesia, while exporting machinery, electronic goods, textiles, and agricultural products.
The two economies benefit from robust shipping connections and shared participation in regional trade agreements such as the RCEP and ASEAN Trade in Goods Agreement.
Bilateral trade has shown steady growth in recent years, with total turnover surpassing US$12 billion annually.