
Vietnam’s largest listed company by market capitalisation, Vingroup, released its Q1 2026 Unaudited Consolidated Financial Statements last week.
These five charts show its Q1 2026 performance against the previous six quarters.
Chart 1: Assets vs. Liabilities
In Q1 of 2026, Vingroup’s total assets increased by VND 57.24 trillion (US$2.17 billion), which is about 5.10 percent over the fourth quarter of 2025. This was below an average increase of 7.43 percent for the preceding five quarters.
By comparison, total liabilities increased by VND 54.99 trillion (US$2.09 billion) or 5.67 percent, which was below an average of 9.42 percent.
Total assets now stand at VND 1,178.69 trillion (US$44.74 billion) with total liabilities of VND 1,024.99 trillion (US$38.90 billion).
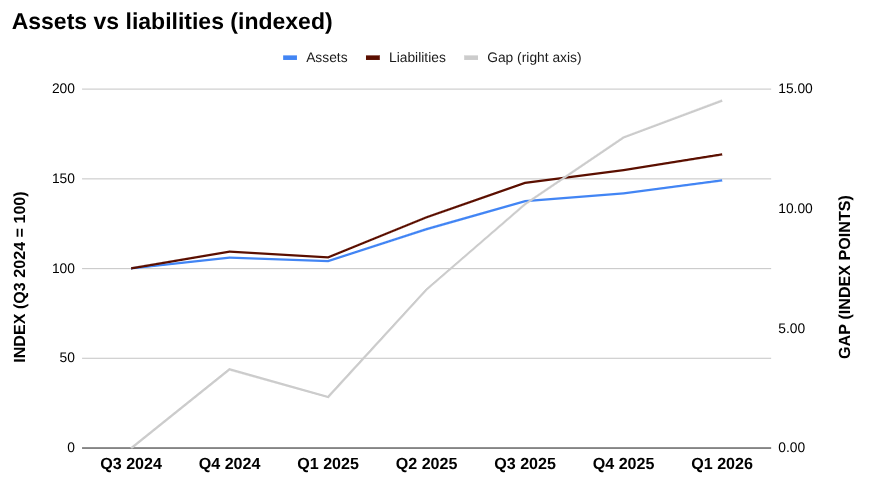
Chart 2: Liabilities to equity
Vingroup’s owner’s equity in the first quarter of 2026 increased by 1.48 percent, or VND 2.25 trillion (US$85.3 million), bringing total owner’s equity to VND 153.70 trillion (about US$5.83 billion).
Vingroup’s total liabilities now stand at 6.66 times equity. This is up from 6.4 in the previous quarter and 4.2 in the first quarter of last year.
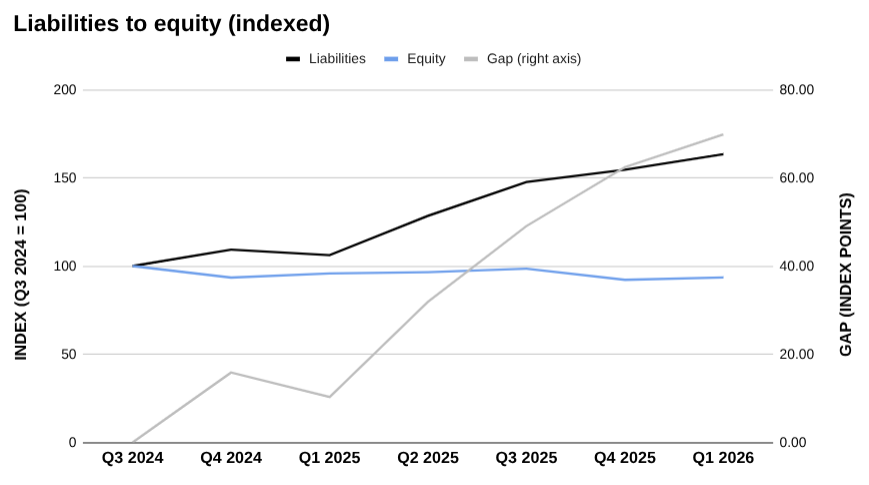
Chart 3: Liabilities to Vietnam GDP
Vietnam’s gross domestic product (GDP) in the first quarter of 2026 was about VND 3.14 quadrillion (US$119.3 billion), bringing cumulative gross domestic product for the four quarters to end-March to VND 13.19 quadrillion (US$500.6 billion).
This puts Vingroup’s total debt now at 7.77 percent of Vietnam’s GDP. This is up from 7.54 percent in the preceding quarter and 5.67 percent in Q1 last year.
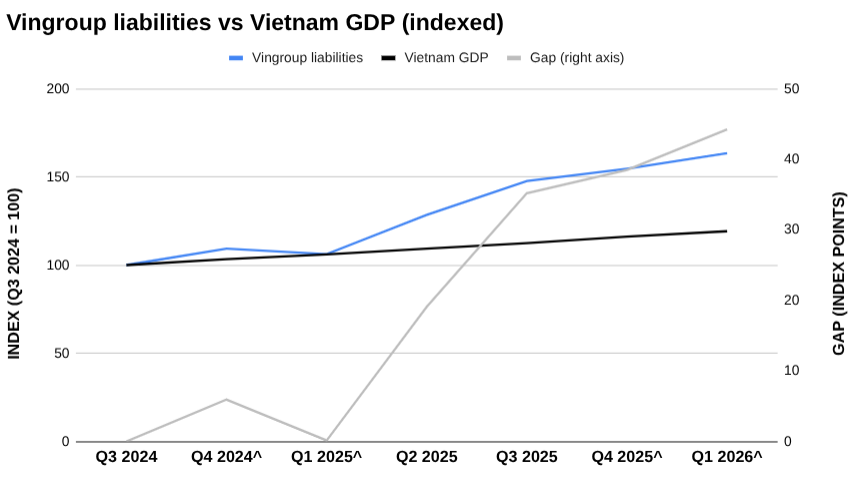
Chart 4: Net revenue vs net profit
Vingroup’s net revenue was down in Q1 of this year, quarter-on-quarter, falling by about VND 58.8 trillion (US$2.23 billion) or 36.04 percent, for total revenue of about VND 104.4 trillion (US$3.96 billion).
Conversely, net profit increased by about VND 508 billion (US$19 million) or 7.50 percent, for a total of about VND 7.3 trillion (US$277 million).
This resulted in a net margin of 6.97 percent.
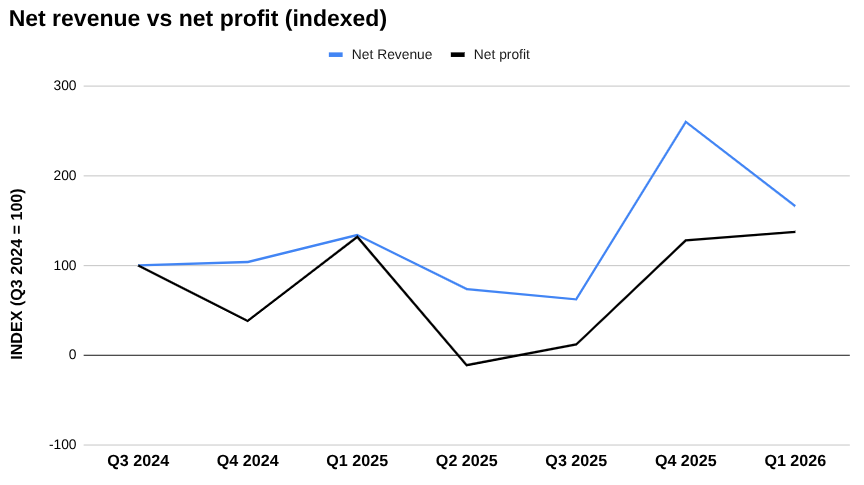
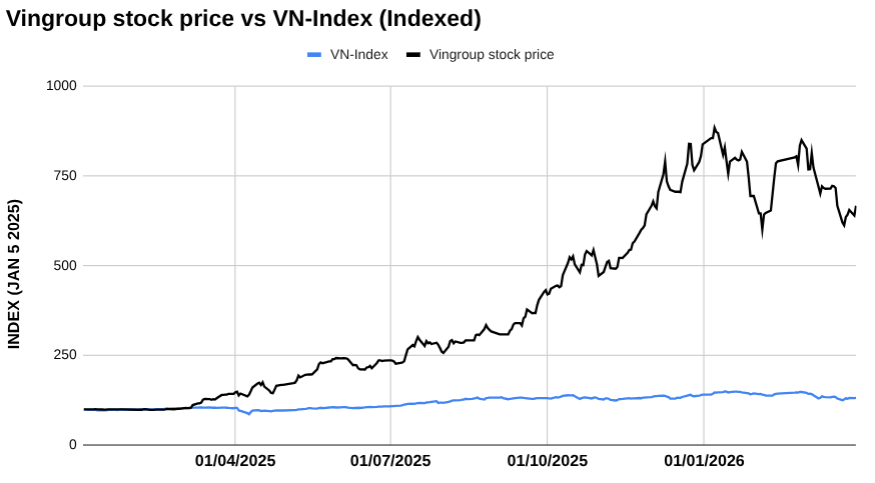
Chart 5: Vingroup’s stock price vs VN-Index
Vingroup’s stock price at the end of the first quarter of 2026 was down VND 38,000 or 22 percent, over the start of January, finishing Q1 at VND 135,000 a share.
This was, however, still much higher than the start of 2025, when Vingroup shares were worth just VND 20,275 each.
The data
Notes on the data:
- Exchange rate: US$1 = VND 26,350.
- GDP from the National Statistics Office quarterly reports.
TABLE: Vingroup income statement / VND millions
| Q3 2024 | Q4 2024 | Q1 2025 | Q2 2025 | Q3 2025 | Q4 2025 | Q1 2026 | |
| Net revenue | 62,850,017 | 65,243,834 | 84,053,349 | 46,312,274 | 39,135,103 | 163,159,401 | 104,352,018 |
| Gross profit | 13,073,504 | 9,999,279 | 19,205,215 | 2,917,635 | -7,289,975 | 37,007,681 | 25,937,626 |
| Operating profit | 5,590,131 | 537,056 | 5,157,863 | -13,907,759 | 4,829,457 | 13,622,941 | 5,084,455 |
| Profit after tax | 2,014,911 | 1,182,459 | 2,243,269 | 2,265,428 | 3,025,338 | 3,581,322 | 5,610,779 |
| Net profit | 5,294,923 | 2,024,698 | 6,978,763 | -580,986 | 640,184 | 6,768,417 | 7,276,018 |
TABLE: Vingroup balance sheet / VND millions
| Q3 2024 | Q4 2024 | Q1 2025 | Q2 2025 | Q3 2025 | Q4 2025 | Q1 2026 | |
| Current assets | 423,990,500 | 400,374,790 | 372,183,892 | 528,475,505 | 590,641,891 | 660,924,812 | 669,086,072 |
| Total assets | 791,473,944 | 839,216,200 | 823,270,248 | 964,438,859 | 1,087,870,325 | 1,121,457,028 | 1,178,694,748 |
| Liabilities | 627,217,065 | 685,698,650 | 665,817,661 | 805,820,866 | 925,966,426 | 970,001,804 | 1,024,990,928 |
| Short-term liabilities | 470,411,783 | 514,844,802 | 440,710,635 | 506,624,303 | 557,896,380 | 592,409,830 | 626,455,564 |
| Owner’s equity | 164,256,879 | 153,517,550 | 157,452,587 | 158,617,993 | 161,903,899 | 151,455,224 | 153,703,820 |
TABLE: Vingroup liabilities to Vietnam GDP / VND millions
| Q3 2024 | Q4 2024^ | Q1 2025^ | Q2 2025 | Q3 2025 | Q4 2025^ | Q1 2026^ | |
| NSO Data | 2,766,493,500 | 2,860,548,750 | 2,933,414,500 | 3,025,284,250 | 3,110,811,500 | 3,214,183,250 | 3,297,482,500 |
| Sum prior 4 quarters / 4 | 2,894,998,000 | 3,297,408,000 | 2,809,099,000 | 3,099,632,000 | 3,237,107,000 | 3,710,895,000 | 3,142,296,000 |
^ indicates preliminary data. All other date estimates.